
A Brand for Conscientious Consumers November 10, 2026
All information in this presentation is as of November 10, 2026. Forward-Looking Statements Certain statements included in this presentation are forward-looking statements for purposes of the safe harbor provisions under the United States Private Securities Litigation Reform Act of 1996, as amended. Forward-looking statements are statements other than statements about historical fact. The forward looking statements in this presentation include, but are not limited to, statements regarding guidance for 2026, including projected 2026 net revenue and projected Adjusted EBITDA, the expectation that fourth quarter net revenue will be modestly below the third quarter and the expectation that direct to consumer revenue will be approximately flat in the fourth quarter of 2026 compared to the third quarter of 2026. These forward-looking statements are subject to a number of risks and uncertainties, and you should not rely upon the forward-looking statements as predictions of future events. The future events and trends discussed in this presentation may not occur and actual results could differ materially and adversely from those anticipated or implied in the forward-looking statements. Grove cannot guarantee that future results, levels of activity, performance, achievements or events and circumstances reflected in the forward-looking statements will occur. Except as required by law, Grove disclaims any obligation to update these forward-looking statements to reflect future events or circumstances. The forward-looking statements are subject to a number of risks and uncertainties, including: potential disruptions relating to Grove’s technology platform transition, changes in business, market, financial, political and legal conditions, risks relating to the uncertainty of the projected financial information; Grove’s ability to successfully expand its business; competition; risks relating to inflation and interest rates; and those factors discussed in documents of Grove filed, or to be filed, with the U.S. Securities and Exchange Commission. If any of these risks materialize or our assumptions prove incorrect, actual results could differ materially from the results implied by these forward-looking statements. These forward-looking statements should not be relied upon as representing Grove’s assessments as of any date subsequent to the date of this presentation. See Risk Factors in our Form 10-Q filed November 10, 2026. Non-GAAP Information Grove uses certain non-GAAP measures in this presentation including Adjusted EBITDA. Grove believes the presentation of its non-GAAP financial measures enhances investors' overall understanding of the company's historical financial performance. The presentation of the company's non-GAAP financial measures is not meant to be considered in isolation or as a substitute for the company's financial results prepared in accordance with GAAP, and the company's non-GAAP measures may be different from non-GAAP measures used by other companies. Reconciliations of these non-GAAP financial measures to the most comparable GAAP measures, may be found in the Appendix at the end of this presentation. Safe Harbor Statement/Non-GAAP Measures

3 Creating and curating products for healthier homes and a healthy planet.
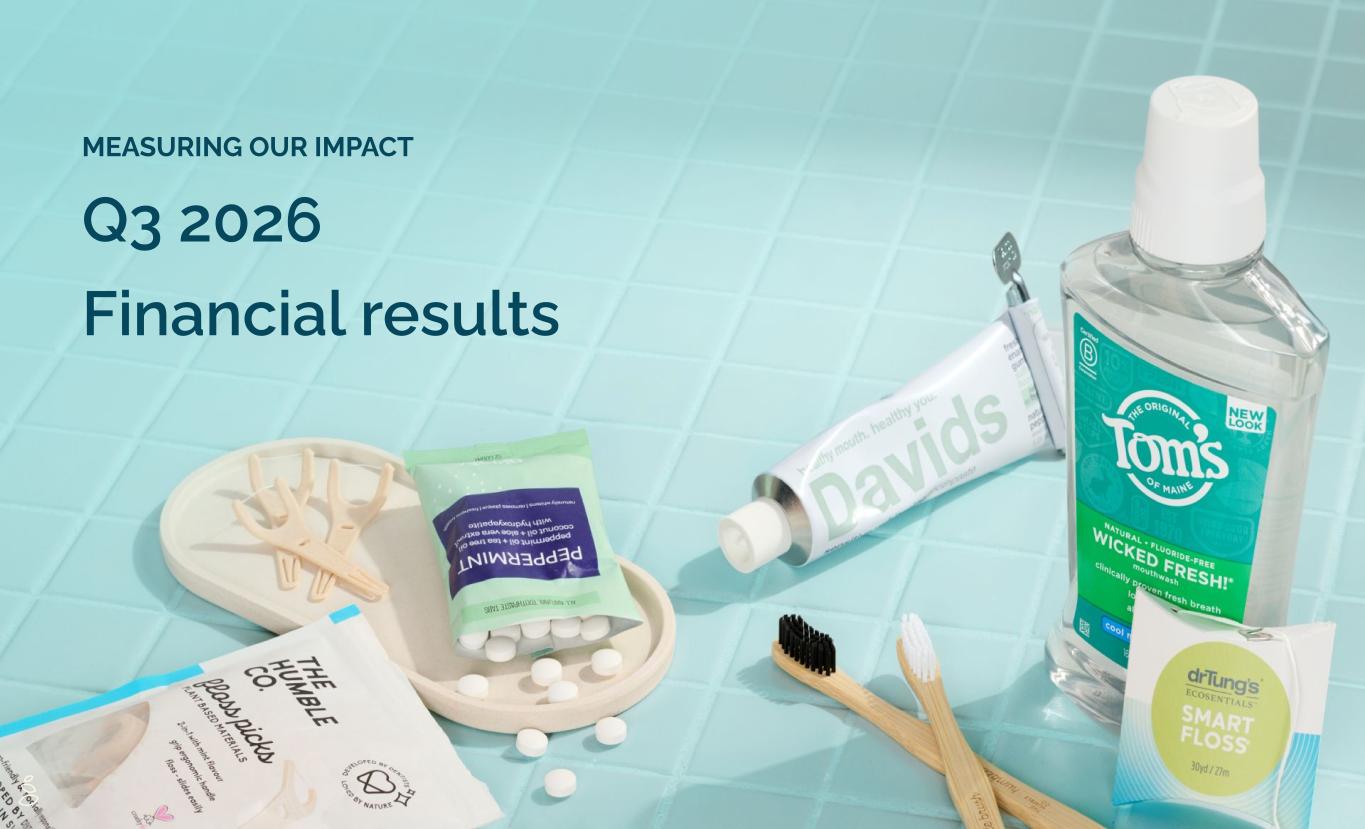
MEASURING OUR IMPACT Q3 2026 Financial results
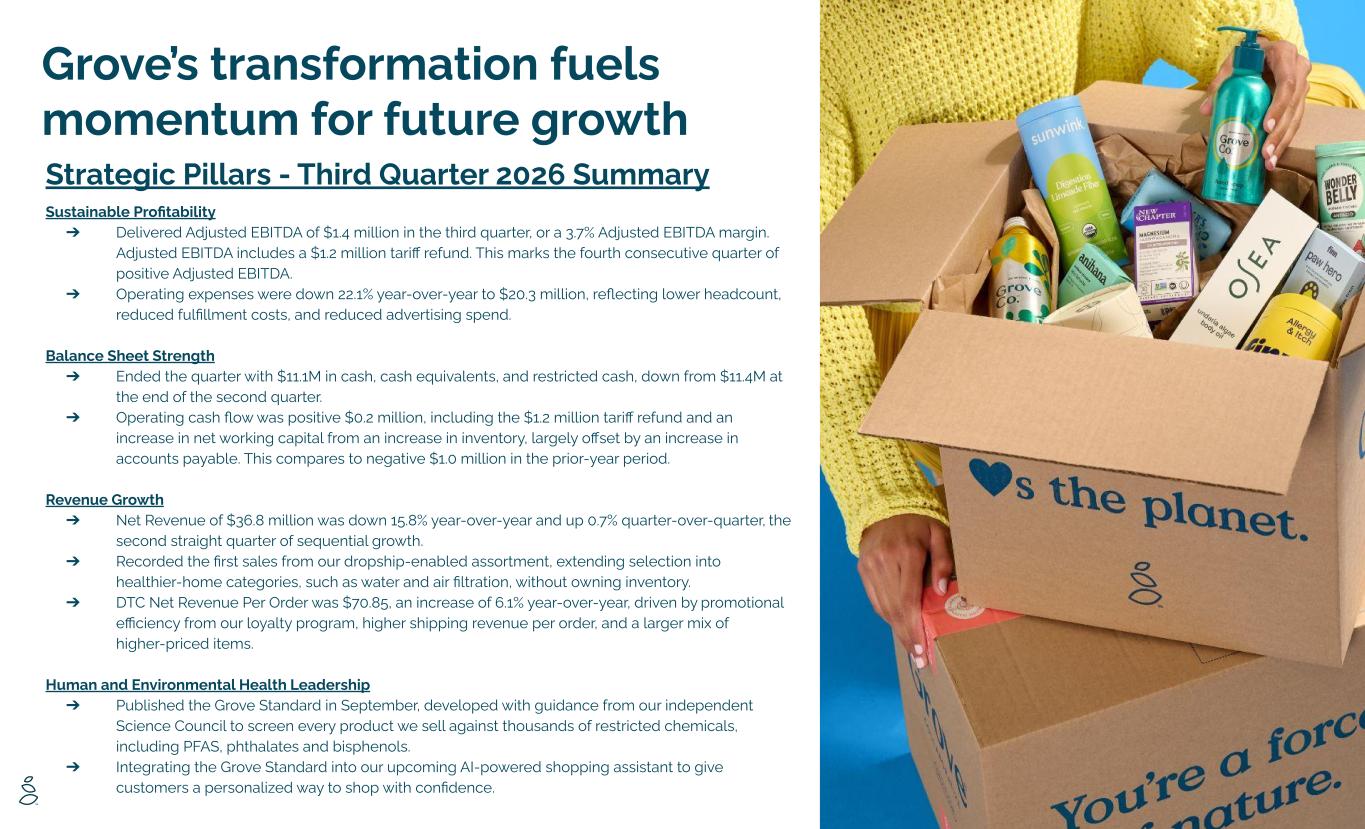
Strategic Pillars - Third Quarter 2026 Summary Sustainable Profitability ➔ Delivered Adjusted EBITDA of $1.4 million in the third quarter, or a 3.7% Adjusted EBITDA margin. Adjusted EBITDA includes a $1.2 million tariff refund. This marks the fourth consecutive quarter of positive Adjusted EBITDA. ➔ Operating expenses were down 22.1% year-over-year to $20.3 million, reflecting lower headcount, reduced fulfillment costs, and reduced advertising spend. Balance Sheet Strength ➔ Ended the quarter with $11.1M in cash, cash equivalents, and restricted cash, down from $11.4M at the end of the second quarter. ➔ Operating cash flow was positive $0.2 million, including the $1.2 million tariff refund and an increase in net working capital from an increase in inventory, largely offset by an increase in accounts payable. This compares to negative $1.0 million in the prior-year period. Revenue Growth ➔ Net Revenue of $36.8 million was down 15.8% year-over-year and up 0.7% quarter-over-quarter, the second straight quarter of sequential growth. ➔ Recorded the first sales from our dropship-enabled assortment, extending selection into healthier-home categories, such as water and air filtration, without owning inventory. ➔ DTC Net Revenue Per Order was $70.85, an increase of 6.1% year-over-year, driven by promotional efficiency from our loyalty program, higher shipping revenue per order, and a larger mix of higher-priced items. Human and Environmental Health Leadership ➔ Published the Grove Standard in September, developed with guidance from our independent Science Council to screen every product we sell against thousands of restricted chemicals, including PFAS, phthalates and bisphenols. ➔ Integrating the Grove Standard into our upcoming AI-powered shopping assistant to give customers a personalized way to shop with confidence. Grove’s transformation fuels momentum for future growth
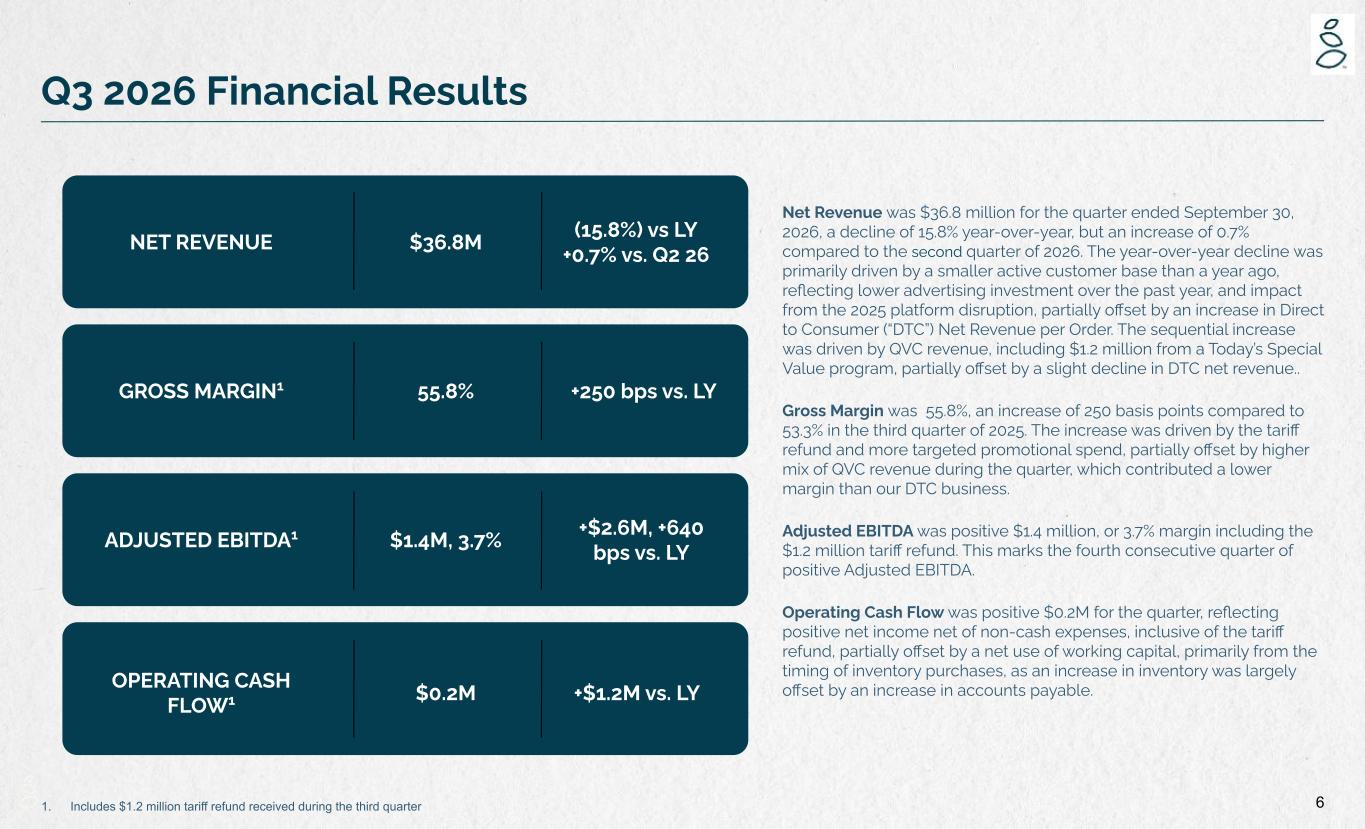
6 Q3 2026 Financial Results ADJUSTED EBITDA1 GROSS MARGIN1 NET REVENUE $36.8M (15.8%) vs LY +0.7% vs. Q2 26 55.8% +250 bps vs. LY $1.4M, 3.7% +$2.6M, +640 bps vs. LY $0.2M +$1.2M vs. LYOPERATING CASH FLOW1 Net Revenue was $36.8 million for the quarter ended September 30, 2026, a decline of 15.8% year-over-year, but an increase of 0.7% compared to the second quarter of 2026. The year-over-year decline was primarily driven by a smaller active customer base than a year ago, reflecting lower advertising investment over the past year, and impact from the 2025 platform disruption, partially offset by an increase in Direct to Consumer (“DTC”) Net Revenue per Order. The sequential increase was driven by QVC revenue, including $1.2 million from a Today’s Special Value program, partially offset by a slight decline in DTC net revenue.. Gross Margin was 55.8%, an increase of 250 basis points compared to 53.3% in the third quarter of 2025. The increase was driven by the tariff refund and more targeted promotional spend, partially offset by higher mix of QVC revenue during the quarter, which contributed a lower margin than our DTC business. Adjusted EBITDA was positive $1.4 million, or 3.7% margin including the $1.2 million tariff refund. This marks the fourth consecutive quarter of positive Adjusted EBITDA. Operating Cash Flow was positive $0.2M for the quarter, reflecting positive net income net of non-cash expenses, inclusive of the tariff refund, partially offset by a net use of working capital, primarily from the timing of inventory purchases, as an increase in inventory was largely offset by an increase in accounts payable. 1. Includes $1.2 million tariff refund received during the third quarter
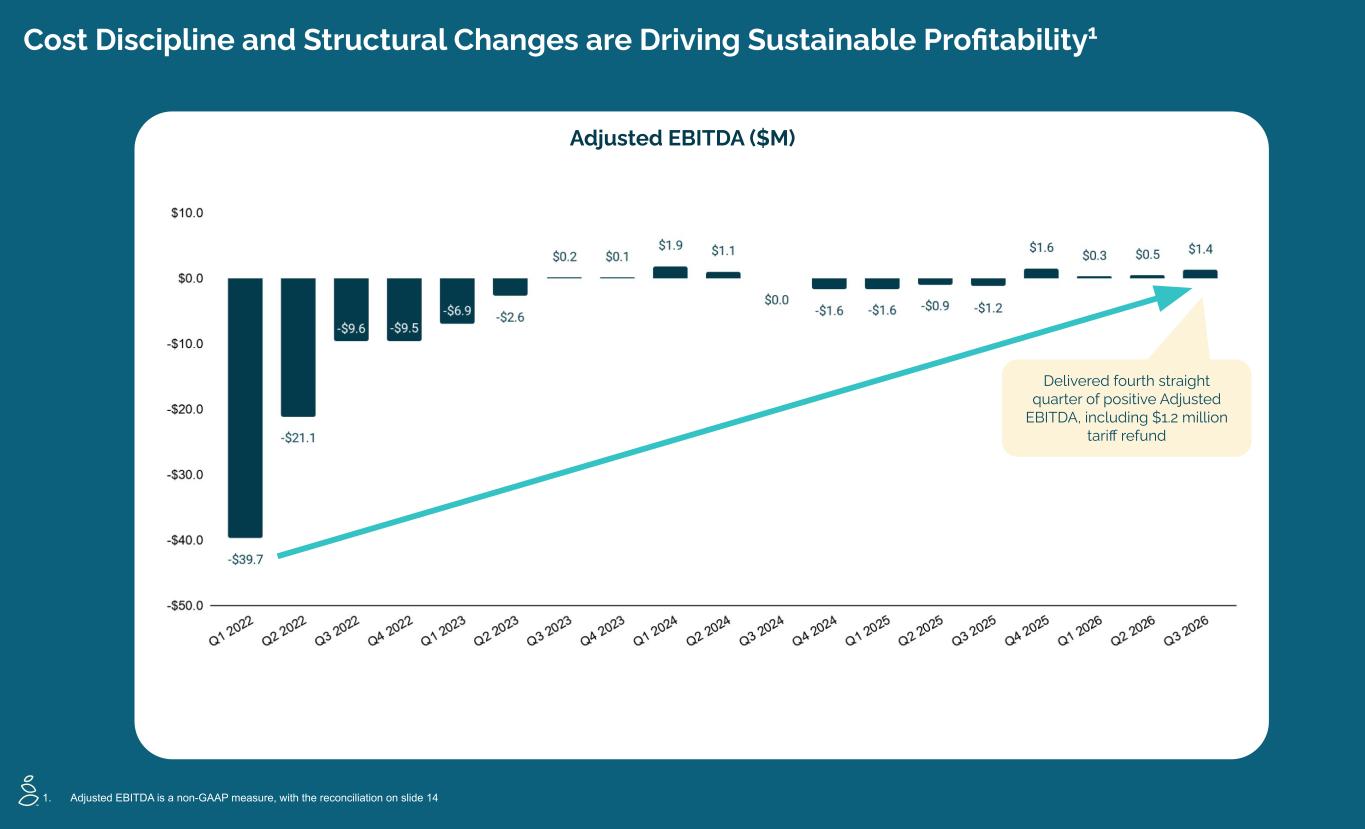
Cost Discipline and Structural Changes are Driving Sustainable Profitability1 Adjusted EBITDA ($M) Delivered fourth straight quarter of positive Adjusted EBITDA, including $1.2 million tariff refund 1. Adjusted EBITDA is a non-GAAP measure, with the reconciliation on slide 14
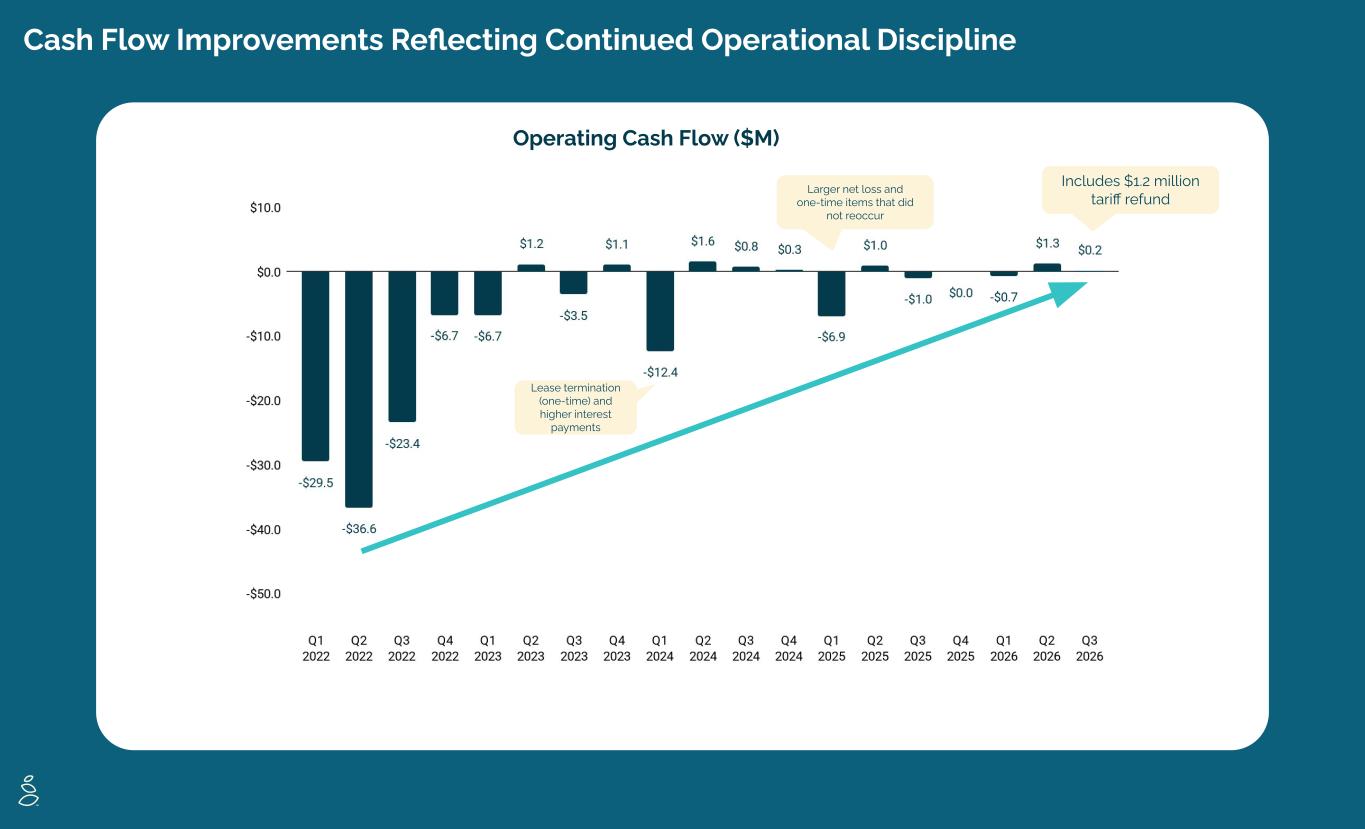
Cash Flow Improvements Reflecting Continued Operational Discipline Operating Cash Flow ($M) Larger net loss and one-time items that did not reoccur Lease termination (one-time) and higher interest payments Includes $1.2 million tariff refund
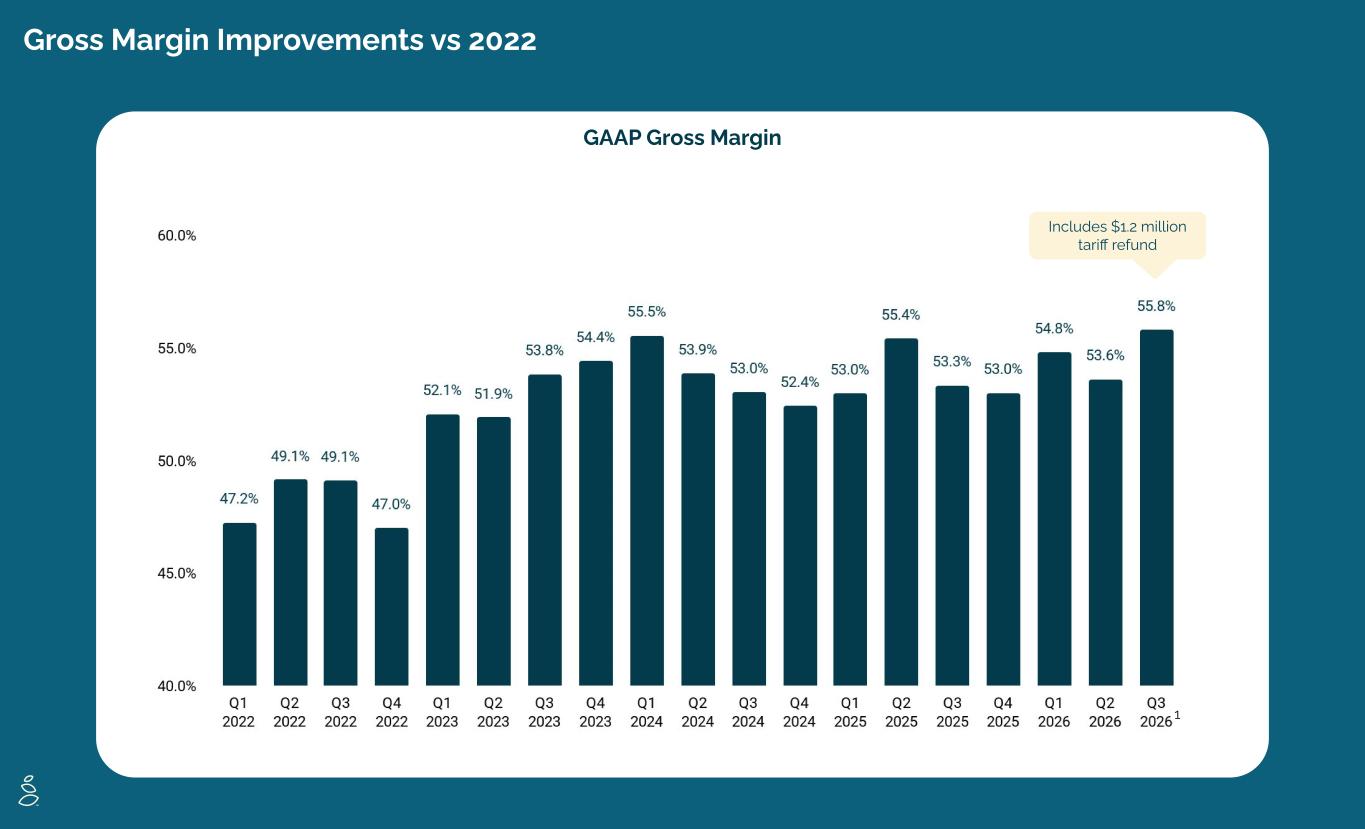
Gross Margin Improvements vs 2022 GAAP Gross Margin 1 Includes $1.2 million tariff refund
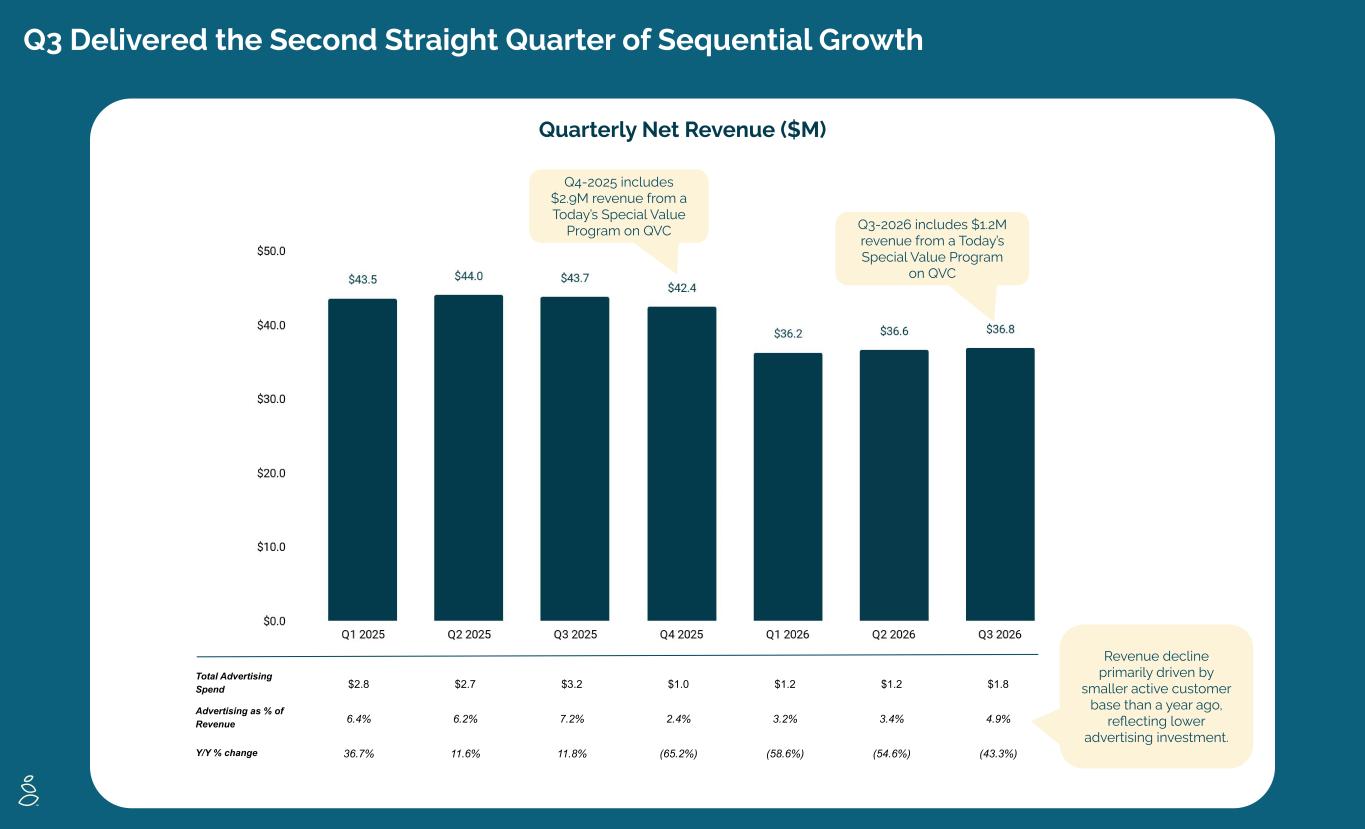
Q3 Delivered the Second Straight Quarter of Sequential Growth Quarterly Net Revenue ($M) Q3-2026 includes $1.2M revenue from a Today’s Special Value Program on QVC Q4-2025 includes $2.9M revenue from a Today’s Special Value Program on QVC Total Advertising Spend $2.8 $2.7 $3.2 $1.0 $1.2 $1.2 $1.8 Advertising as % of Revenue 6.4% 6.2% 7.2% 2.4% 3.2% 3.4% 4.9% Y/Y % change 36.7% 11.6% 11.8% (65.2%) (58.6%) (54.6%) (43.3%) Revenue decline primarily driven by smaller active customer base than a year ago, reflecting lower advertising investment.
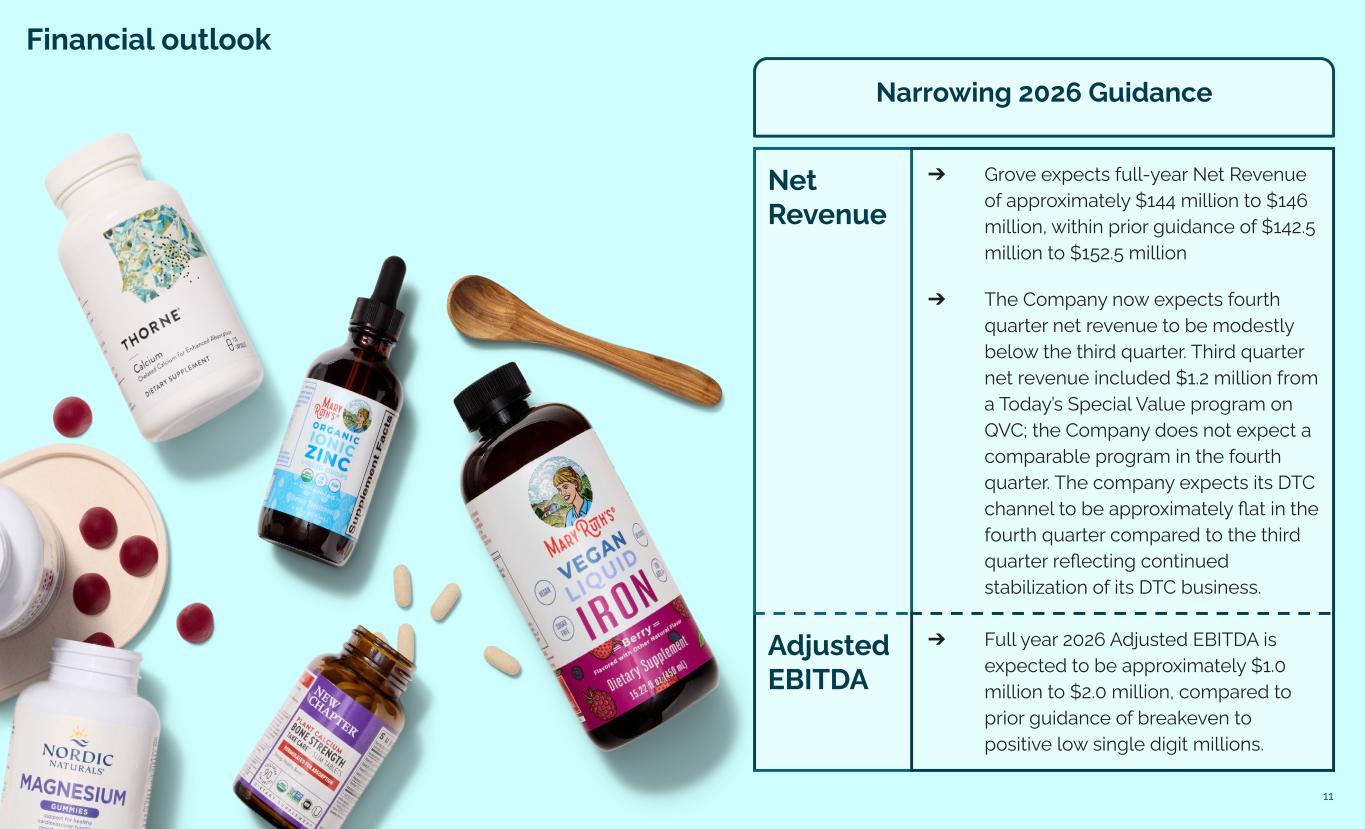
11 Financial outlook Net Revenue ➔ Grove expects full-year Net Revenue of approximately $144 million to $146 million, within prior guidance of $142.5 million to $152.5 million ➔ The Company now expects fourth quarter net revenue to be modestly below the third quarter. Third quarter net revenue included $1.2 million from a Today’s Special Value program on QVC; the Company does not expect a comparable program in the fourth quarter. The company expects its DTC channel to be approximately flat in the fourth quarter compared to the third quarter reflecting continued stabilization of its DTC business. Adjusted EBITDA ➔ Full year 2026 Adjusted EBITDA is expected to be approximately $1.0 million to $2.0 million, compared to prior guidance of breakeven to positive low single digit millions. Narrowing 2026 Guidance
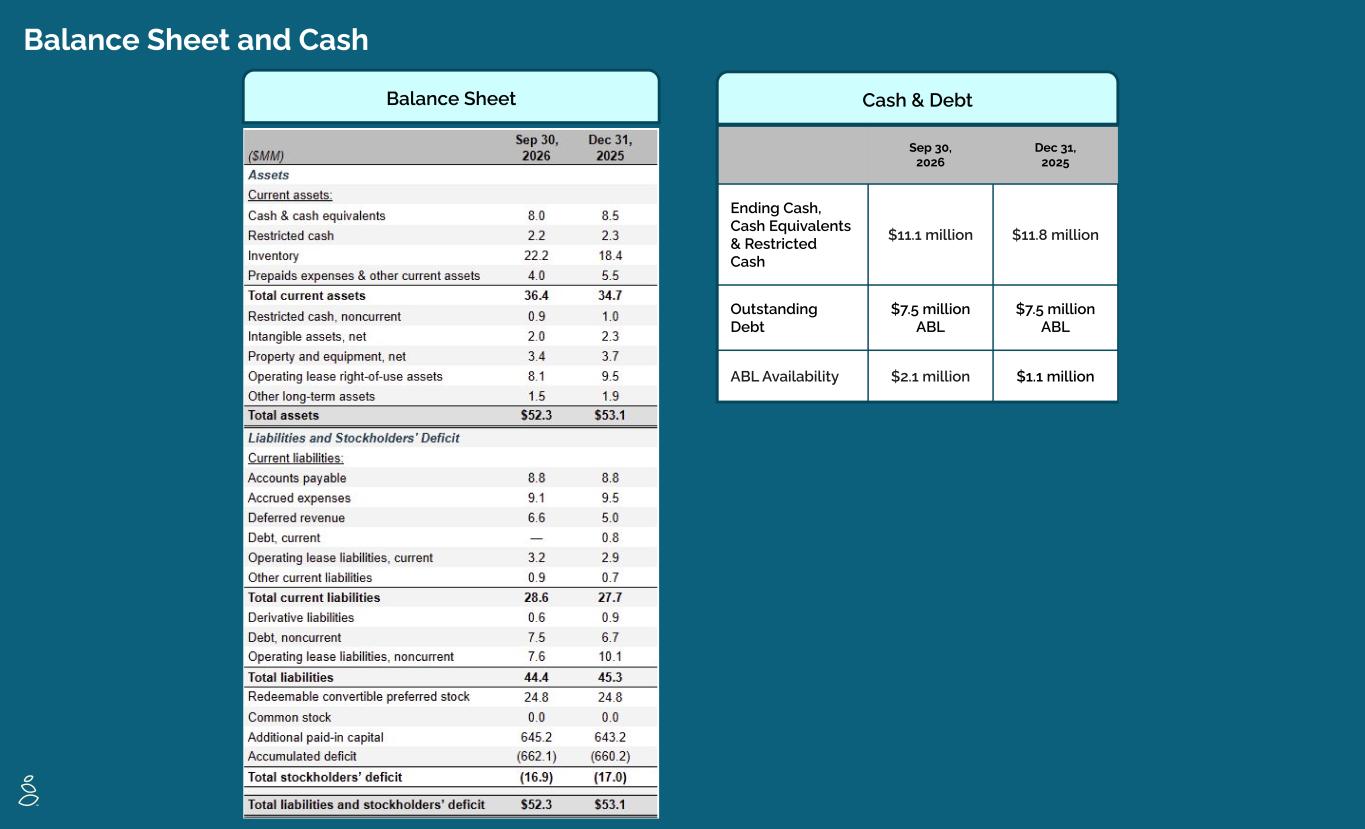
Balance Sheet and Cash Balance Sheet Cash & Debt Sep 30, 2026 Dec 31, 2025 Ending Cash, Cash Equivalents & Restricted Cash $11.1 million $11.8 million Outstanding Debt $7.5 million ABL $7.5 million ABL ABL Availability $2.1 million $1.1 million
Appendix
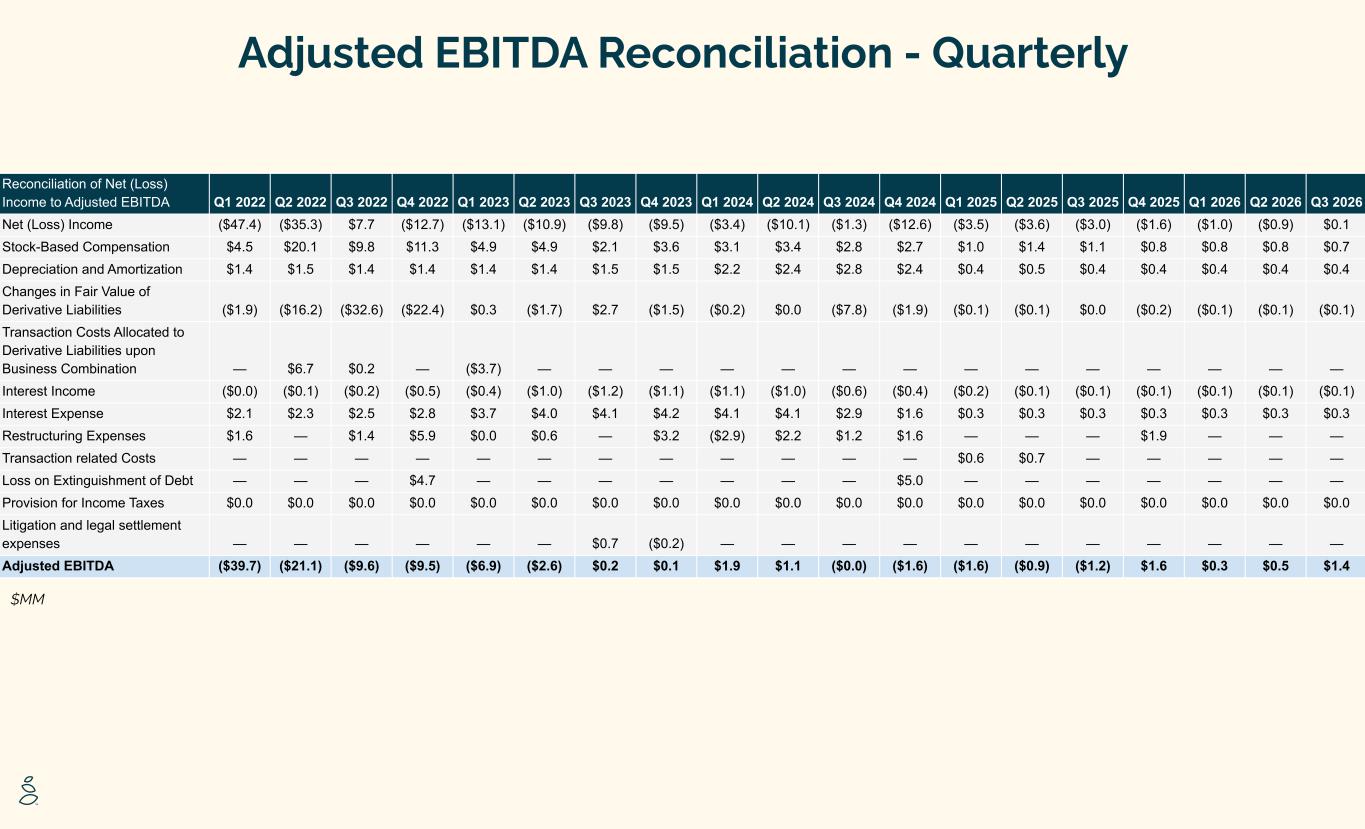
Adjusted EBITDA Reconciliation - Quarterly $MM Reconciliation of Net (Loss) Income to Adjusted EBITDA Q1 2022 Q2 2022 Q3 2022 Q4 2022 Q1 2023 Q2 2023 Q3 2023 Q4 2023 Q1 2024 Q2 2024 Q3 2024 Q4 2024 Q1 2025 Q2 2025 Q3 2025 Q4 2025 Q1 2026 Q2 2026 Q3 2026 Net (Loss) Income ($47.4) ($35.3) $7.7 ($12.7) ($13.1) ($10.9) ($9.8) ($9.5) ($3.4) ($10.1) ($1.3) ($12.6) ($3.5) ($3.6) ($3.0) ($1.6) ($1.0) ($0.9) $0.1 Stock-Based Compensation $4.5 $20.1 $9.8 $11.3 $4.9 $4.9 $2.1 $3.6 $3.1 $3.4 $2.8 $2.7 $1.0 $1.4 $1.1 $0.8 $0.8 $0.8 $0.7 Depreciation and Amortization $1.4 $1.5 $1.4 $1.4 $1.4 $1.4 $1.5 $1.5 $2.2 $2.4 $2.8 $2.4 $0.4 $0.5 $0.4 $0.4 $0.4 $0.4 $0.4 Changes in Fair Value of Derivative Liabilities ($1.9) ($16.2) ($32.6) ($22.4) $0.3 ($1.7) $2.7 ($1.5) ($0.2) $0.0 ($7.8) ($1.9) ($0.1) ($0.1) $0.0 ($0.2) ($0.1) ($0.1) ($0.1) Transaction Costs Allocated to Derivative Liabilities upon Business Combination — $6.7 $0.2 — ($3.7) — — — — — — — — — — — — — — Interest Income ($0.0) ($0.1) ($0.2) ($0.5) ($0.4) ($1.0) ($1.2) ($1.1) ($1.1) ($1.0) ($0.6) ($0.4) ($0.2) ($0.1) ($0.1) ($0.1) ($0.1) ($0.1) ($0.1) Interest Expense $2.1 $2.3 $2.5 $2.8 $3.7 $4.0 $4.1 $4.2 $4.1 $4.1 $2.9 $1.6 $0.3 $0.3 $0.3 $0.3 $0.3 $0.3 $0.3 Restructuring Expenses $1.6 — $1.4 $5.9 $0.0 $0.6 — $3.2 ($2.9) $2.2 $1.2 $1.6 — — — $1.9 — — — Transaction related Costs — — — — — — — — — — — — $0.6 $0.7 — — — — — Loss on Extinguishment of Debt — — — $4.7 — — — — — — — $5.0 — — — — — — — Provision for Income Taxes $0.0 $0.0 $0.0 $0.0 $0.0 $0.0 $0.0 $0.0 $0.0 $0.0 $0.0 $0.0 $0.0 $0.0 $0.0 $0.0 $0.0 $0.0 $0.0 Litigation and legal settlement expenses — — — — — — $0.7 ($0.2) — — — — — — — — — — — Adjusted EBITDA ($39.7) ($21.1) ($9.6) ($9.5) ($6.9) ($2.6) $0.2 $0.1 $1.9 $1.1 ($0.0) ($1.6) ($1.6) ($0.9) ($1.2) $1.6 $0.3 $0.5 $1.4
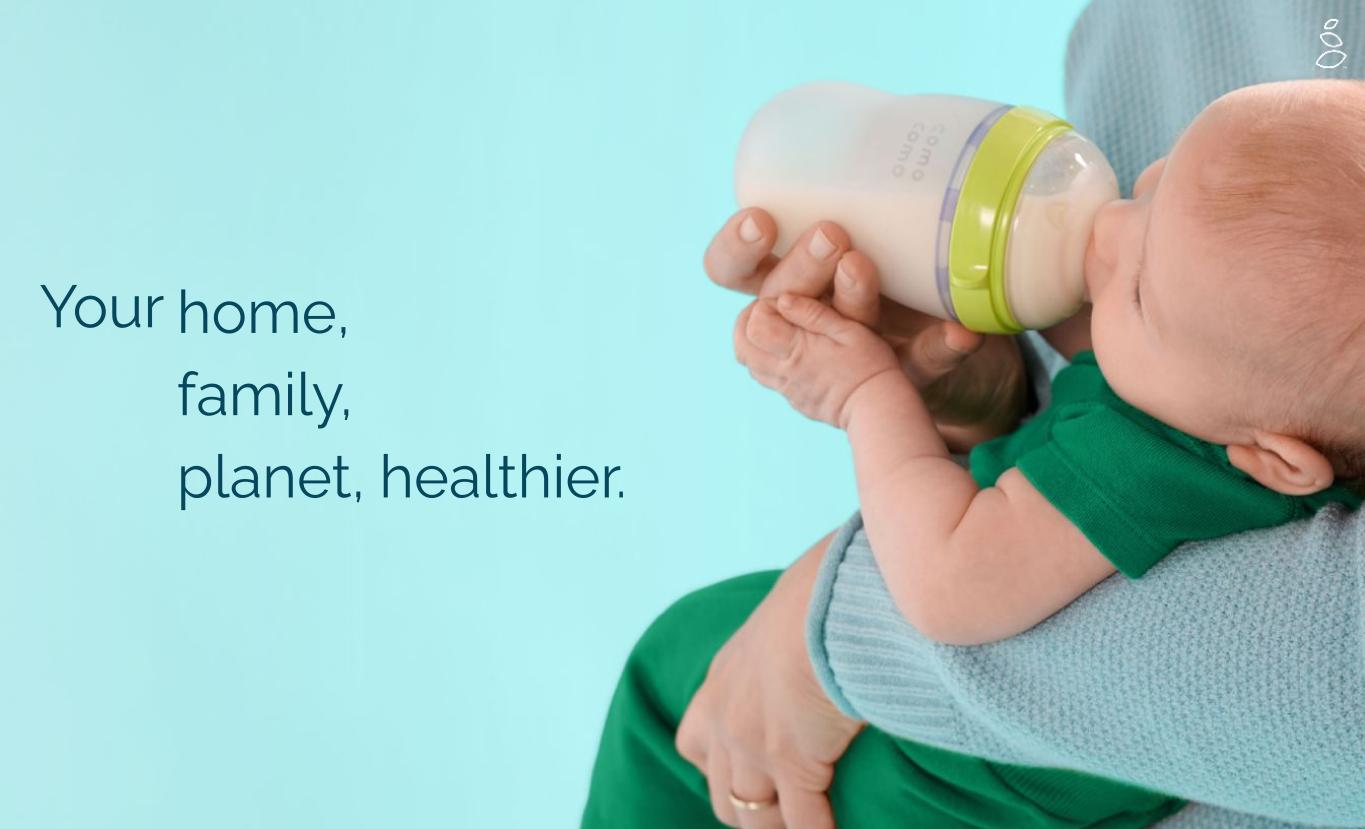
15 home, family, planet, healthier. Your

16