A Brand for Conscientious Consumers August 2026 Exhibit 99.2
All information in this presentation is as of August 6, 2026. Forward-Looking Statements Certain statements included in this presentation are forward-looking statements for purposes of the safe harbor provisions under the United States Private Securities Litigation Reform Act of 1996, as amended. Forward-looking statements are statements other than statements about historical fact. The forward looking statements in this presentation include, but are not limited to, statements regarding quarterly sequential revenue growth from the first quarter 2026, revenue and Adjusted EBITDA for 2026, projected measured increase in advertising investment, projected sustained improved repeat order rates from platform improvements, projected growth in non-DTC channels, guidance for 2026, including projected 2026 net revenue and Adjusted EBITDA and sequential revenue improvement in each of the remaining quarters of 2026. These forward-looking statements are subject to a number of risks and uncertainties, and you should not rely upon the forward-looking statements as predictions of future events. The future events and trends discussed in this presentation may not occur and actual results could differ materially and adversely from those anticipated or implied in the forward-looking statements. Grove cannot guarantee that future results, levels of activity, performance, achievements or events and circumstances reflected in the forward-looking statements will occur. Except as required by law, Grove disclaims any obligation to update these forward-looking statements to reflect future events or circumstances. The forward-looking statements are subject to a number of risks and uncertainties, including: potential disruptions relating to Grove’s technology platform transition, changes in business, market, financial, political and legal conditions, risks relating to the uncertainty of the projected financial information; Grove’s ability to successfully expand its business; competition; risks relating to inflation and interest rates; and those factors discussed in documents of Grove filed, or to be filed, with the U.S. Securities and Exchange Commission. If any of these risks materialize or our assumptions prove incorrect, actual results could differ materially from the results implied by these forward-looking statements. These forward-looking statements should not be relied upon as representing Grove’s assessments as of any date subsequent to the date of this presentation. See Risk Factors in our Form 10-Q filed August 6, 2026. Non-GAAP Information Grove uses certain non-GAAP measures in this presentation including Adjusted EBITDA. Grove believes the presentation of its non-GAAP financial measures enhances investors' overall understanding of the company's historical financial performance. The presentation of the company's non-GAAP financial measures is not meant to be considered in isolation or as a substitute for the company's financial results prepared in accordance with GAAP, and the company's non-GAAP measures may be different from non-GAAP measures used by other companies. Reconciliations of these non-GAAP financial measures to the most comparable GAAP measures, may be found in the Appendix at the end of this presentation. Safe Harbor Statement/Non-GAAP Measures
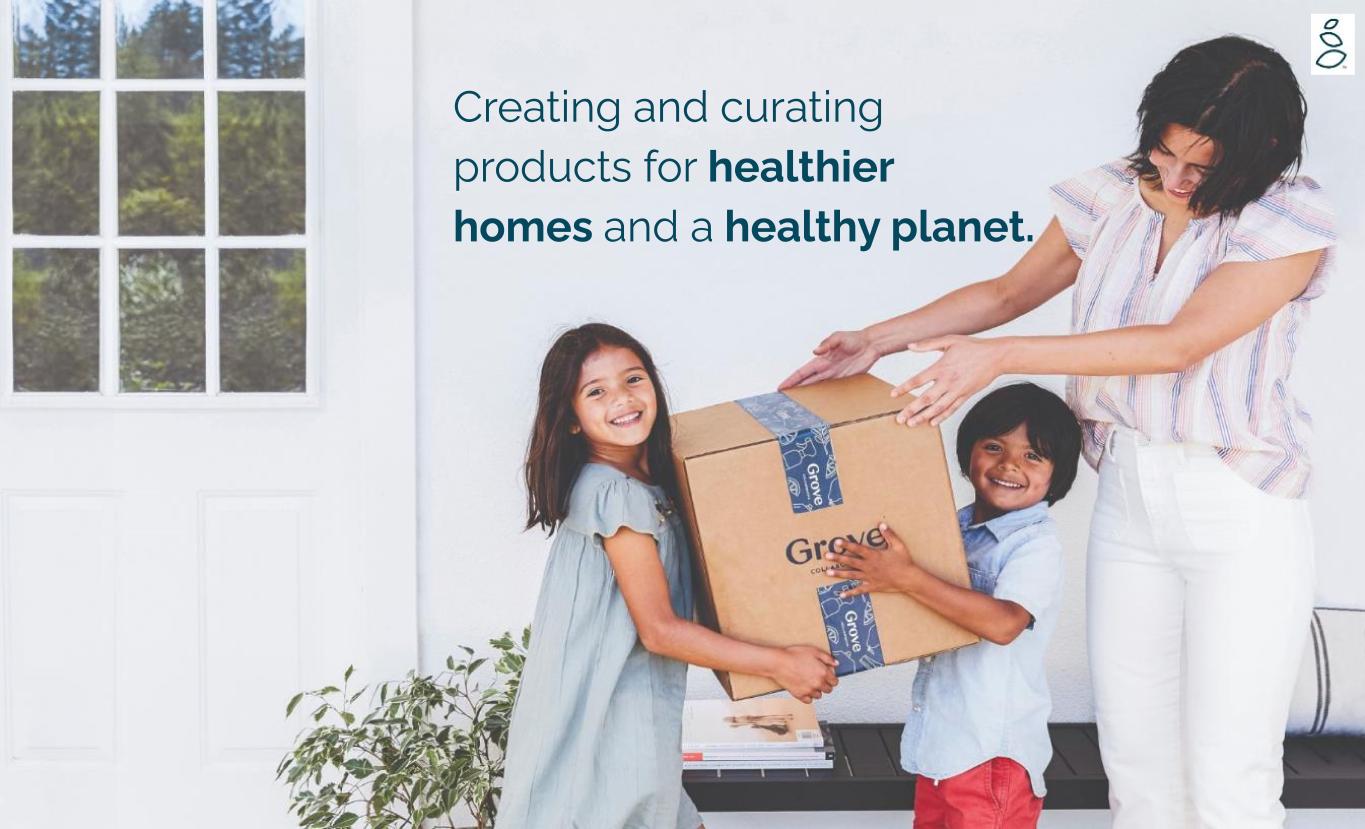
3 Creating and curating products for healthier homes and a healthy planet.
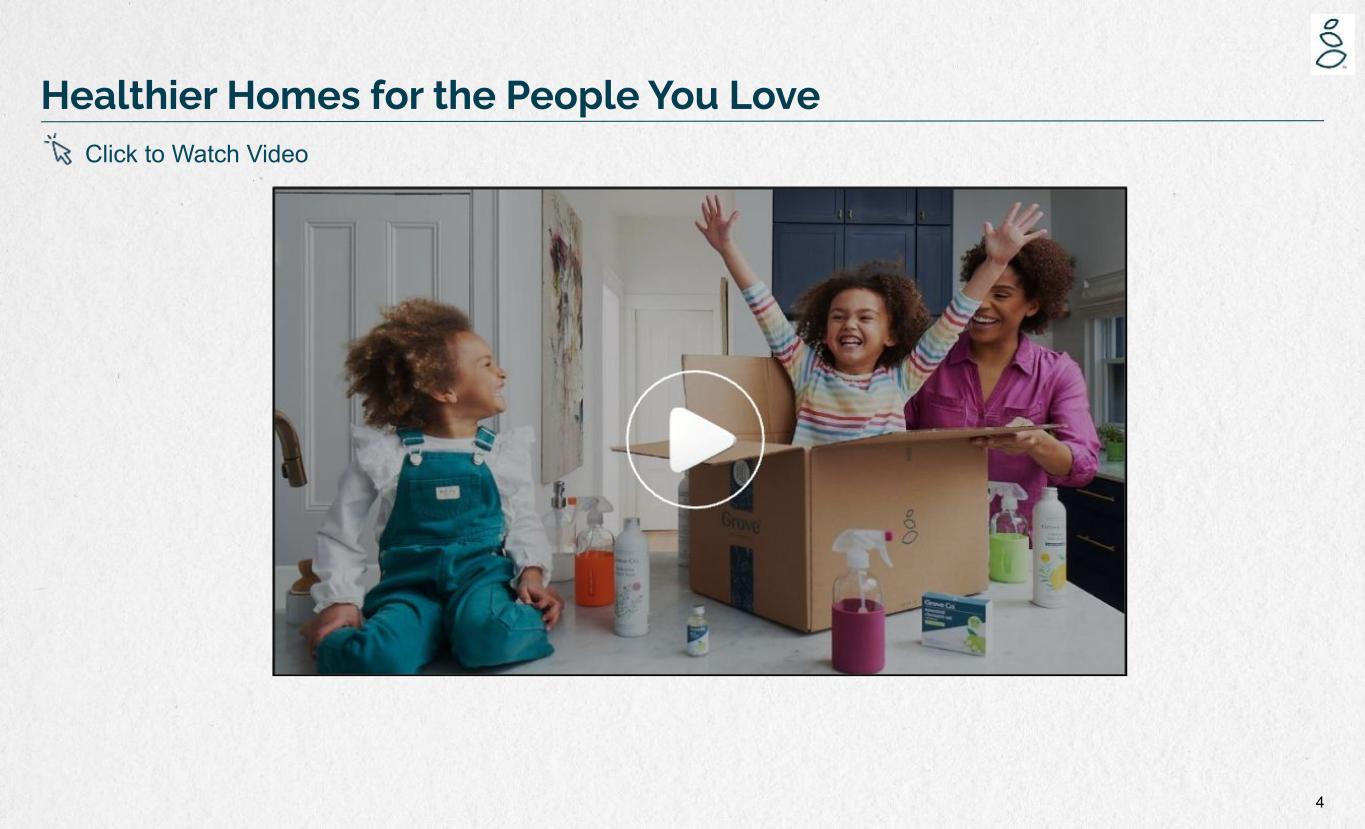
4 Healthier Homes for the People You Love Click to Watch Video
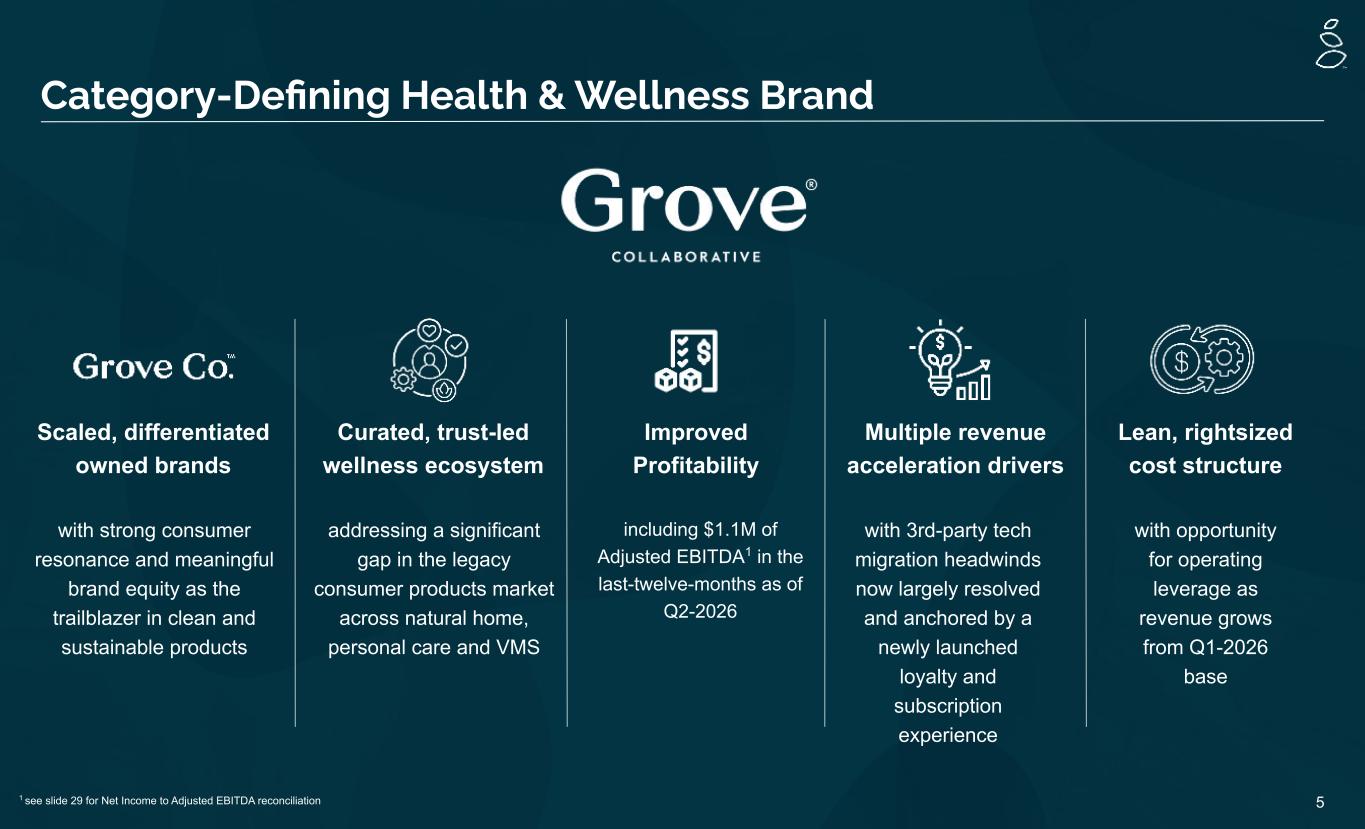
5 Category-Defining Health & Wellness Brand Scaled, differentiated owned brands Multiple revenue acceleration drivers Lean, rightsized cost structure Curated, trust-led wellness ecosystem with opportunity for operating leverage as revenue grows from Q1-2026 base with 3rd-party tech migration headwinds now largely resolved and anchored by a newly launched loyalty and subscription experience Improved Profitability with strong consumer resonance and meaningful brand equity as the trailblazer in clean and sustainable products addressing a significant gap in the legacy consumer products market across natural home, personal care and VMS including $1.1M of Adjusted EBITDA1 in the last-twelve-months as of Q2-2026 1 see slide 29 for Net Income to Adjusted EBITDA reconciliation
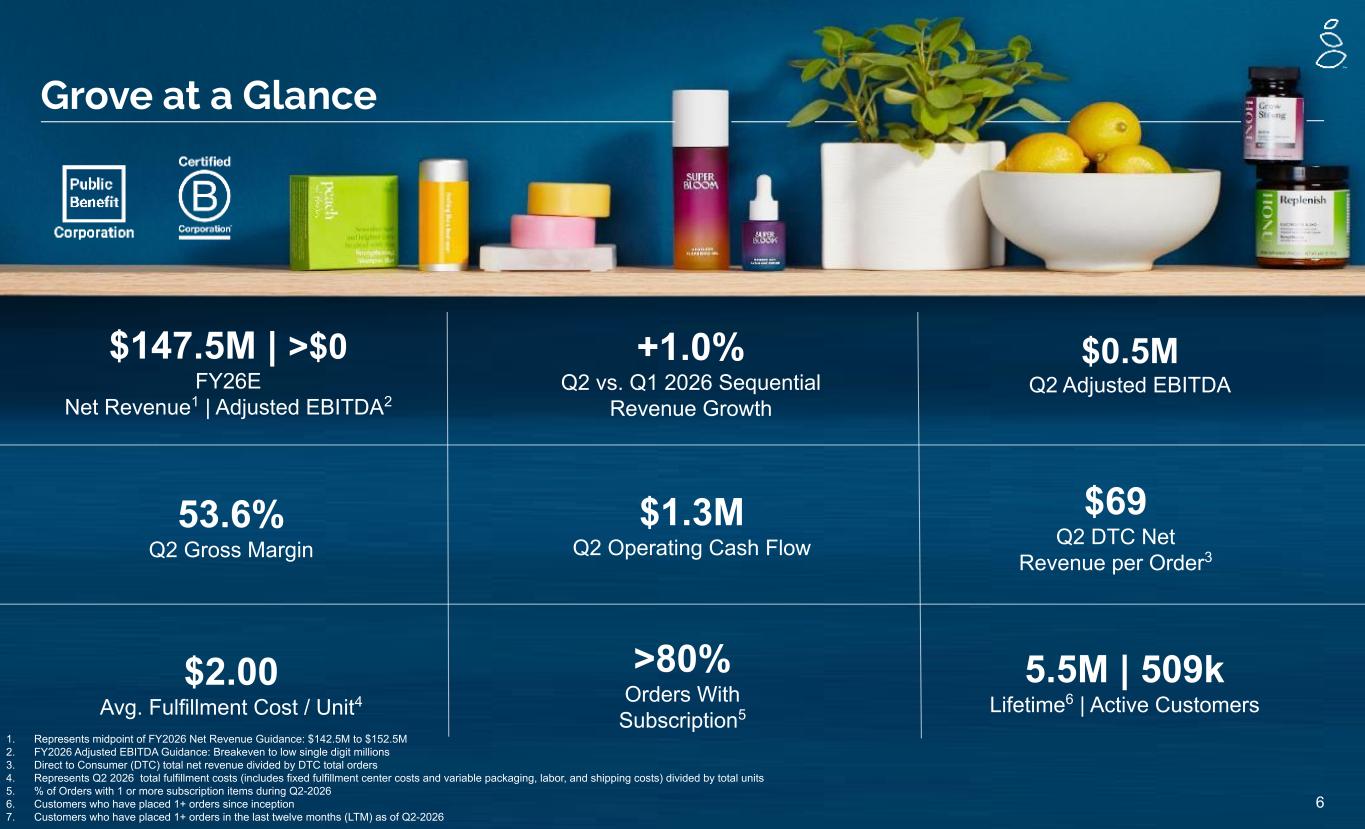
6 Grove at a Glance $147.5M | >$0 FY26E Net Revenue1 | Adjusted EBITDA2 $2.00 Avg. Fulfillment Cost / Unit4 $69 Q2 DTC Net Revenue per Order3 +1.0% Q2 vs. Q1 2026 Sequential Revenue Growth >80% Orders With Subscription5 $0.5M Q2 Adjusted EBITDA 53.6% Q2 Gross Margin 1. Represents midpoint of FY2026 Net Revenue Guidance: $142.5M to $152.5M 2. FY2026 Adjusted EBITDA Guidance: Breakeven to low single digit millions 3. Direct to Consumer (DTC) total net revenue divided by DTC total orders 4. Represents Q2 2026 total fulfillment costs (includes fixed fulfillment center costs and variable packaging, labor, and shipping costs) divided by total units 5. % of Orders with 1 or more subscription items during Q2-2026 6. Customers who have placed 1+ orders since inception 7. Customers who have placed 1+ orders in the last twelve months (LTM) as of Q2-2026 $1.3M Q2 Operating Cash Flow 5.5M | 509k Lifetime6 | Active Customers
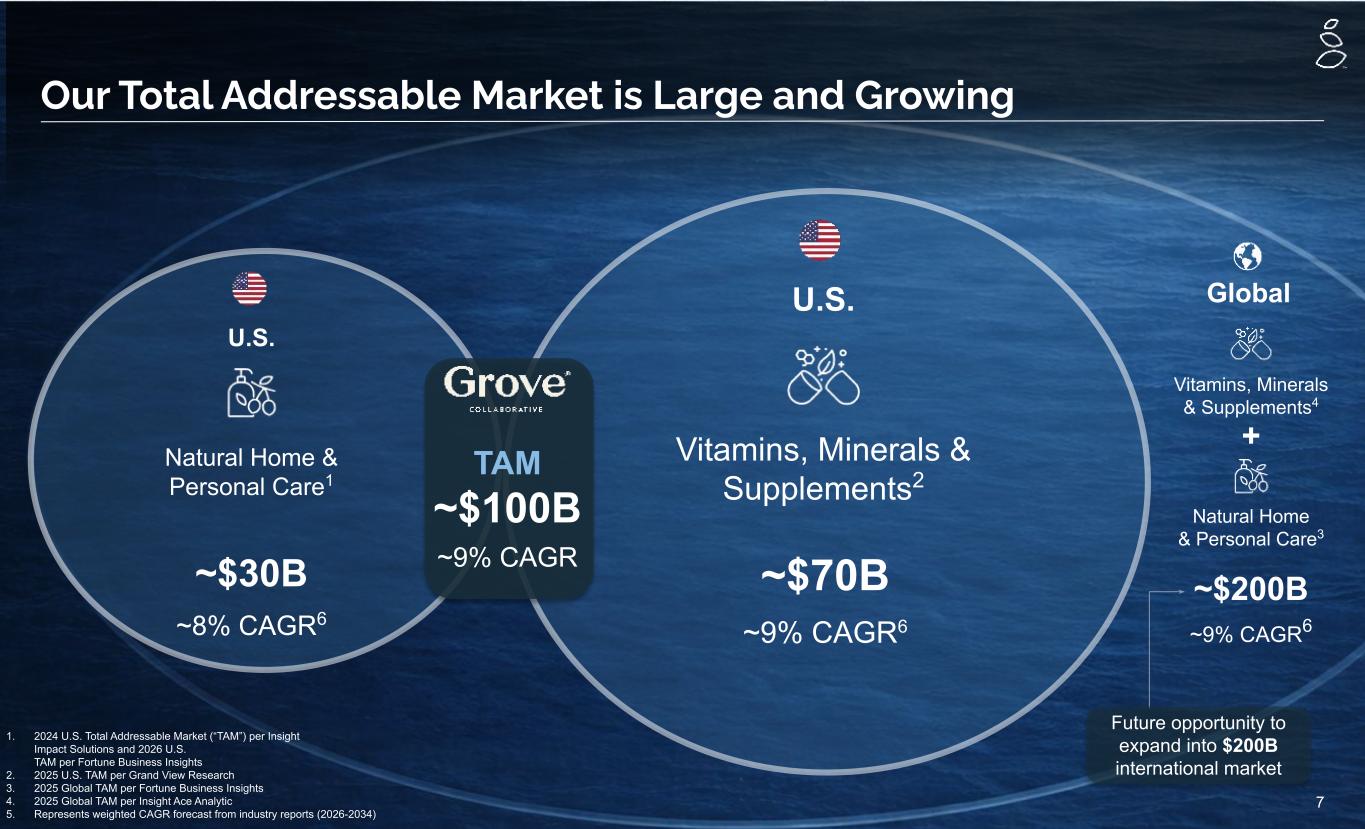
7 Our Total Addressable Market is Large and Growing Natural Home & Personal Care3 ~$200B ~9% CAGR6 +Vitamins, Minerals & Supplements2 ~$70B ~9% CAGR6 U.S. U.S. Natural Home & Personal Care1 ~$30B ~8% CAGR6 1. 2024 U.S. Total Addressable Market (“TAM”) per Insight Impact Solutions and 2026 U.S. TAM per Fortune Business Insights 2. 2025 U.S. TAM per Grand View Research 3. 2025 Global TAM per Fortune Business Insights 4. 2025 Global TAM per Insight Ace Analytic 5. Represents weighted CAGR forecast from industry reports (2026-2034) TAM ~$100B ~9% CAGR Vitamins, Minerals & Supplements4 Global Future opportunity to expand into $200B international market
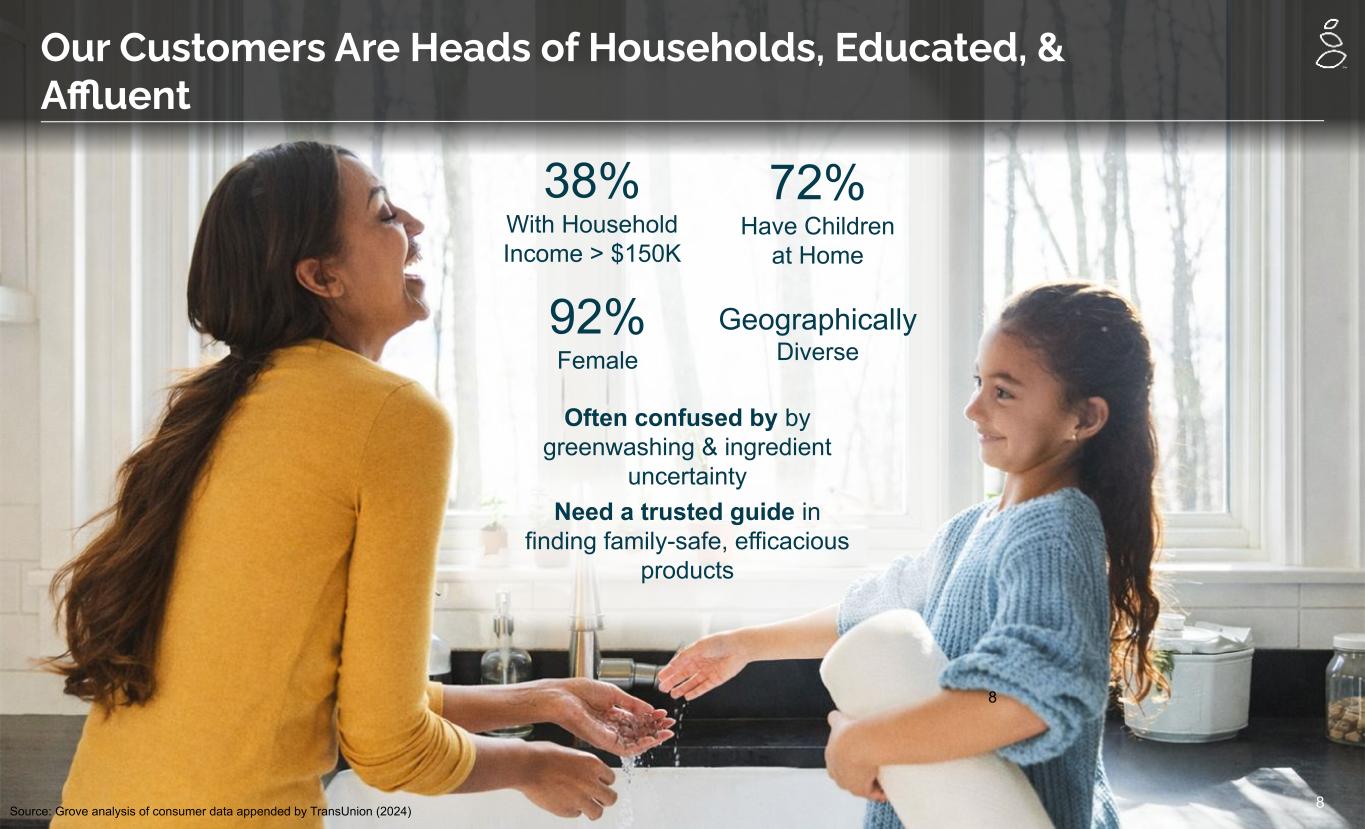
8 38% With Household Income > $150K Often confused by by greenwashing & ingredient uncertainty 72% Have Children at Home 92% Female Geographically Diverse Need a trusted guide in finding family-safe, efficacious products Our Customers Are Heads of Households, Educated, & Affluent Source: Grove analysis of consumer data appended by TransUnion (2024) 8
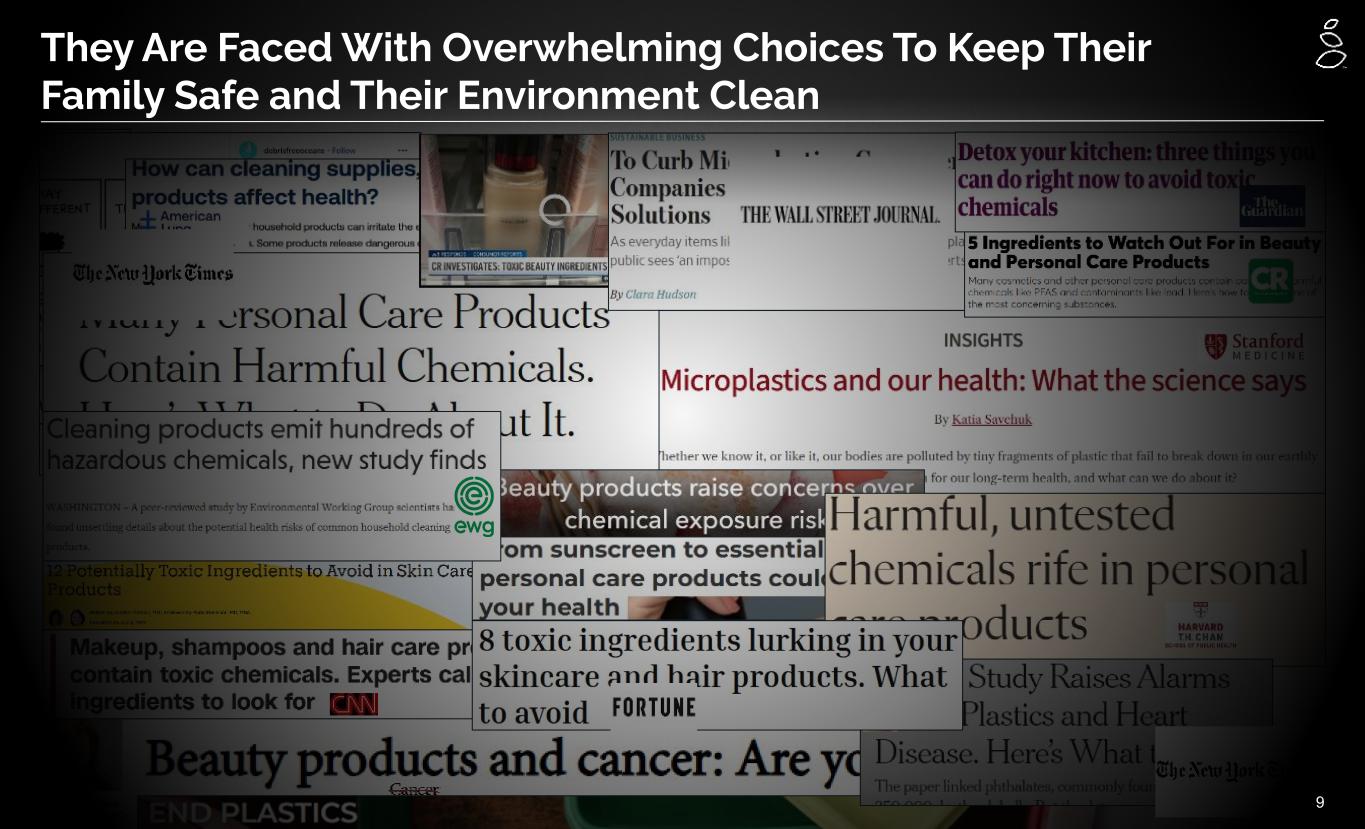
9 They Are Faced With Overwhelming Choices To Keep Their Family Safe and Their Environment Clean
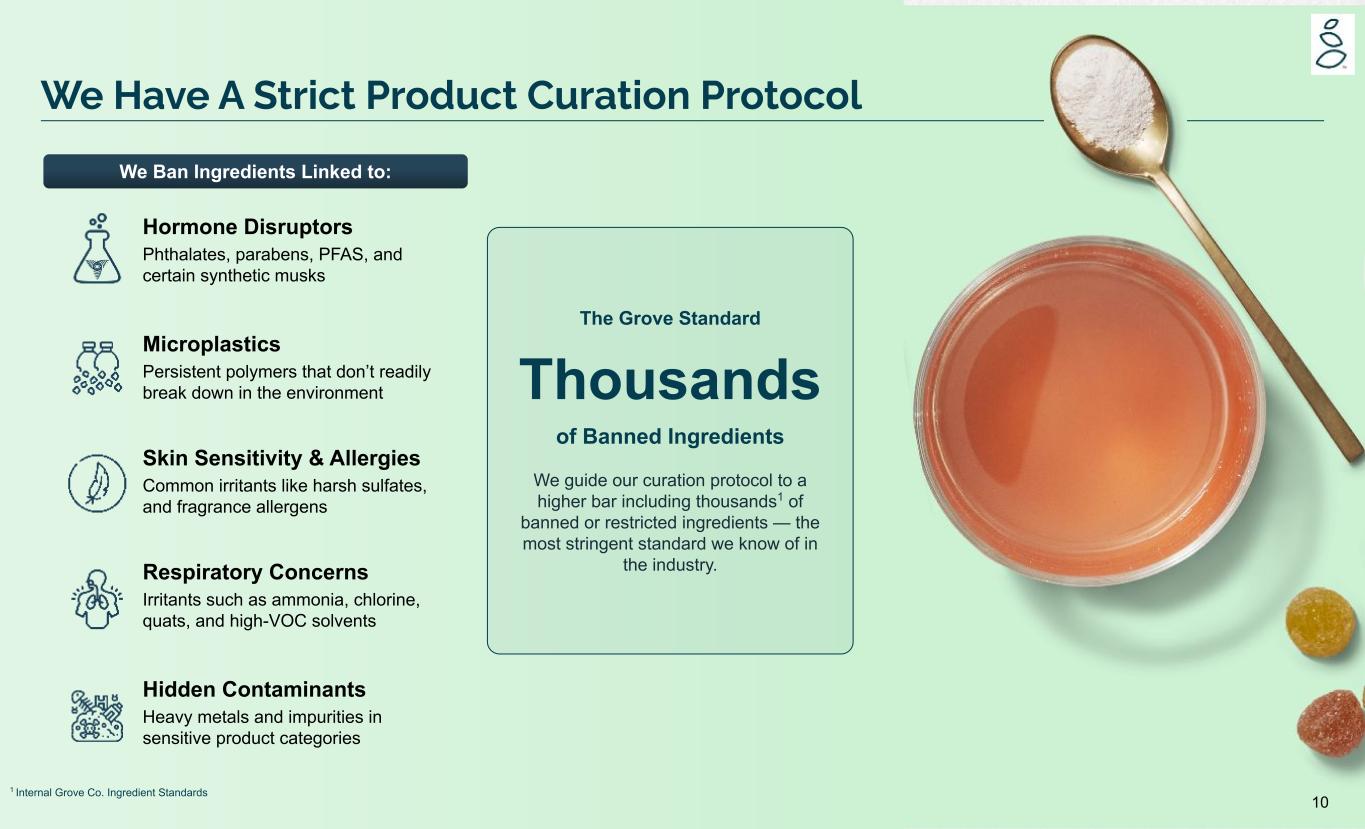
10 We Have A Strict Product Curation Protocol We Ban Ingredients Linked to: Hormone Disruptors Phthalates, parabens, PFAS, and certain synthetic musks Microplastics Persistent polymers that don’t readily break down in the environment Skin Sensitivity & Allergies Common irritants like harsh sulfates, and fragrance allergens Respiratory Concerns Irritants such as ammonia, chlorine, quats, and high-VOC solvents Hidden Contaminants Heavy metals and impurities in sensitive product categories 1 Internal Grove Co. Ingredient Standards The Grove Standard Thousands of Banned Ingredients We guide our curation protocol to a higher bar including thousands1 of banned or restricted ingredients — the most stringent standard we know of in the industry.
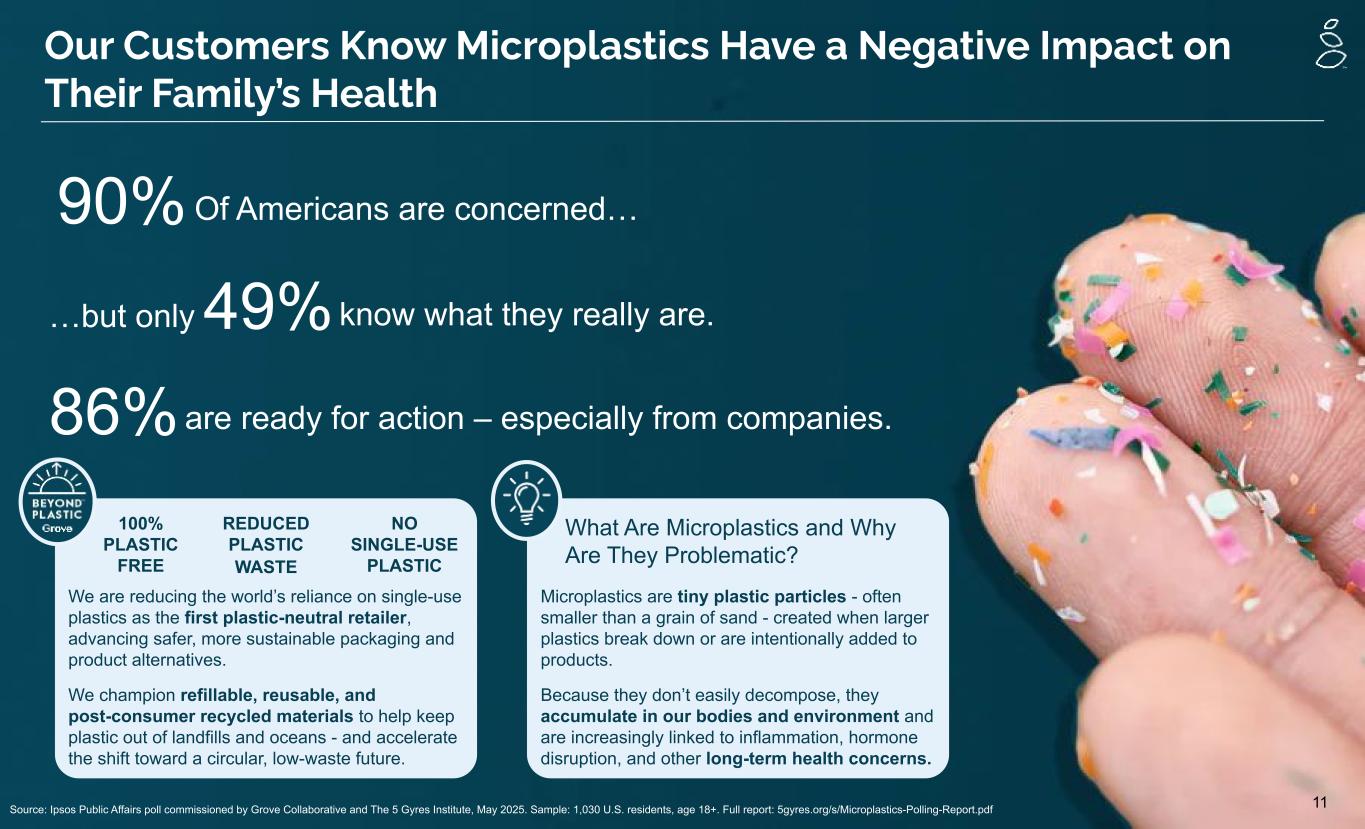
11 Our Customers Know Microplastics Have a Negative Impact on Their Family’s Health 90% Of Americans are concerned… 49%…but only know what they really are. 86% are ready for action – especially from companies. Microplastics are tiny plastic particles - often smaller than a grain of sand - created when larger plastics break down or are intentionally added to products. Because they don’t easily decompose, they accumulate in our bodies and environment and are increasingly linked to inflammation, hormone disruption, and other long-term health concerns. 100% PLASTIC FREE REDUCED PLASTIC WASTE NO SINGLE-USE PLASTIC We are reducing the world’s reliance on single-use plastics as the first plastic-neutral retailer, advancing safer, more sustainable packaging and product alternatives. We champion refillable, reusable, and post-consumer recycled materials to help keep plastic out of landfills and oceans - and accelerate the shift toward a circular, low-waste future. What Are Microplastics and Why Are They Problematic? Source: Ipsos Public Affairs poll commissioned by Grove Collaborative and The 5 Gyres Institute, May 2025. Sample: 1,030 U.S. residents, age 18+. Full report: 5gyres.org/s/Microplastics-Polling-Report.pdf
Direct-to-Consumer Experience
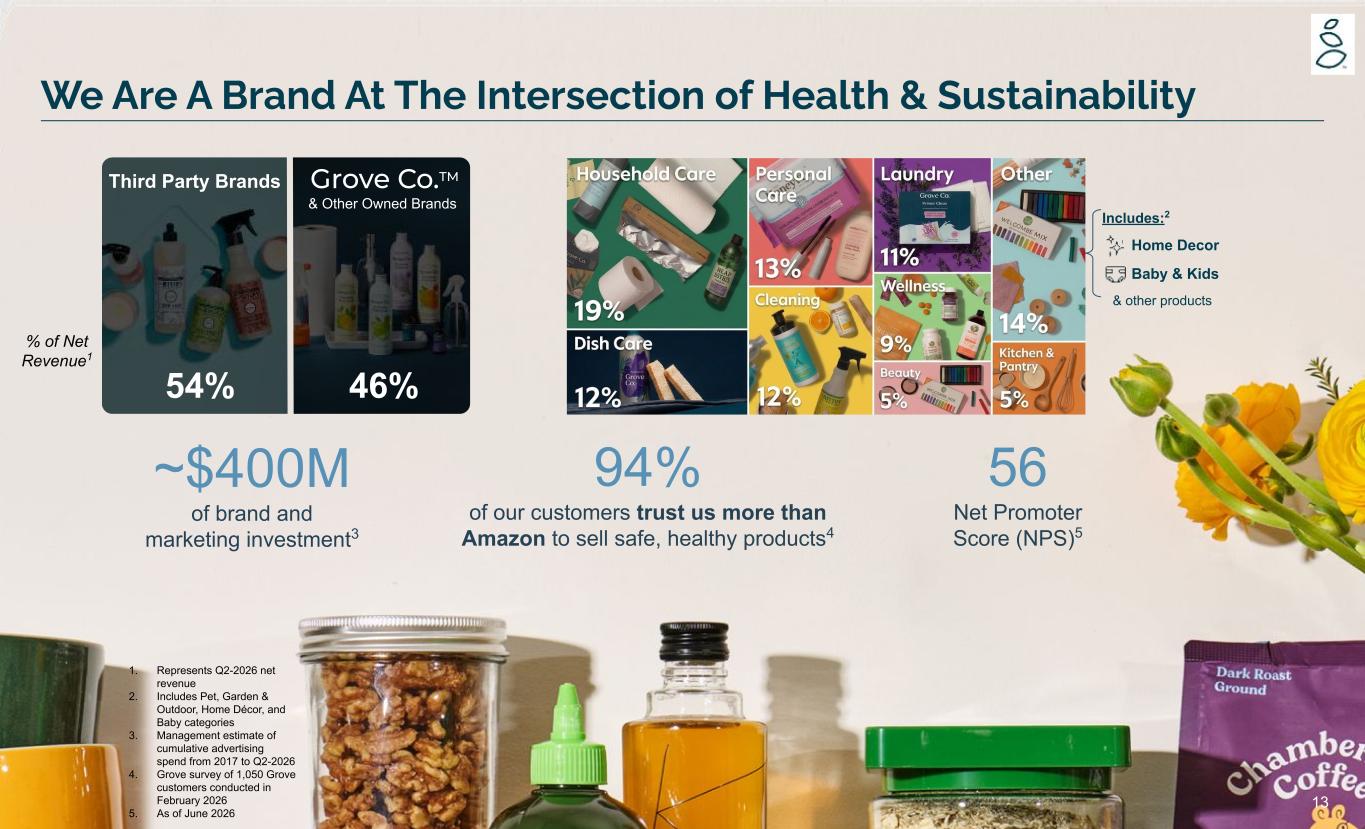
13 We Are A Brand At The Intersection of Health & Sustainability 94% of our customers trust us more than Amazon to sell safe, healthy products4 56 Net Promoter Score (NPS)5 46% Third Party Brands 54% % of Net Revenue1 Includes:2 Baby & Kids Home Decor & other products 1. Represents Q2-2026 net revenue 2. Includes Pet, Garden & Outdoor, Home Décor, and Baby categories 3. Management estimate of cumulative advertising spend from 2017 to Q2-2026 4. Grove survey of 1,050 Grove customers conducted in February 2026 5. As of June 2026 ~$400M of brand and marketing investment3 Grove Co.TM & Other Owned Brands
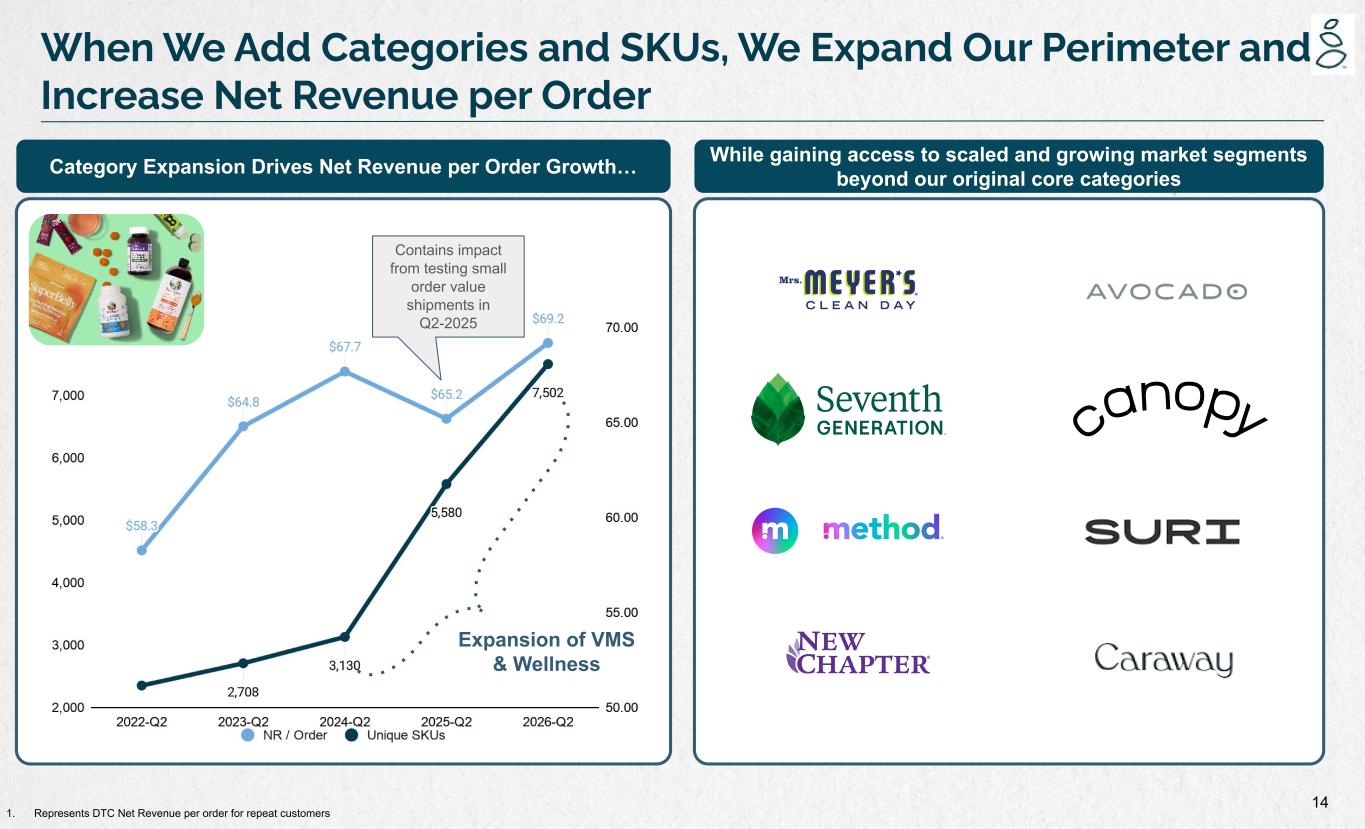
14 When We Add Categories and SKUs, We Expand Our Perimeter and Increase Net Revenue per Order Category Expansion Drives Net Revenue per Order Growth… 1. Represents DTC Net Revenue per order for repeat customers While gaining access to scaled and growing market segments beyond our original core categories Expansion of VMS & Wellness Contains impact from testing small order value shipments in Q2-2025
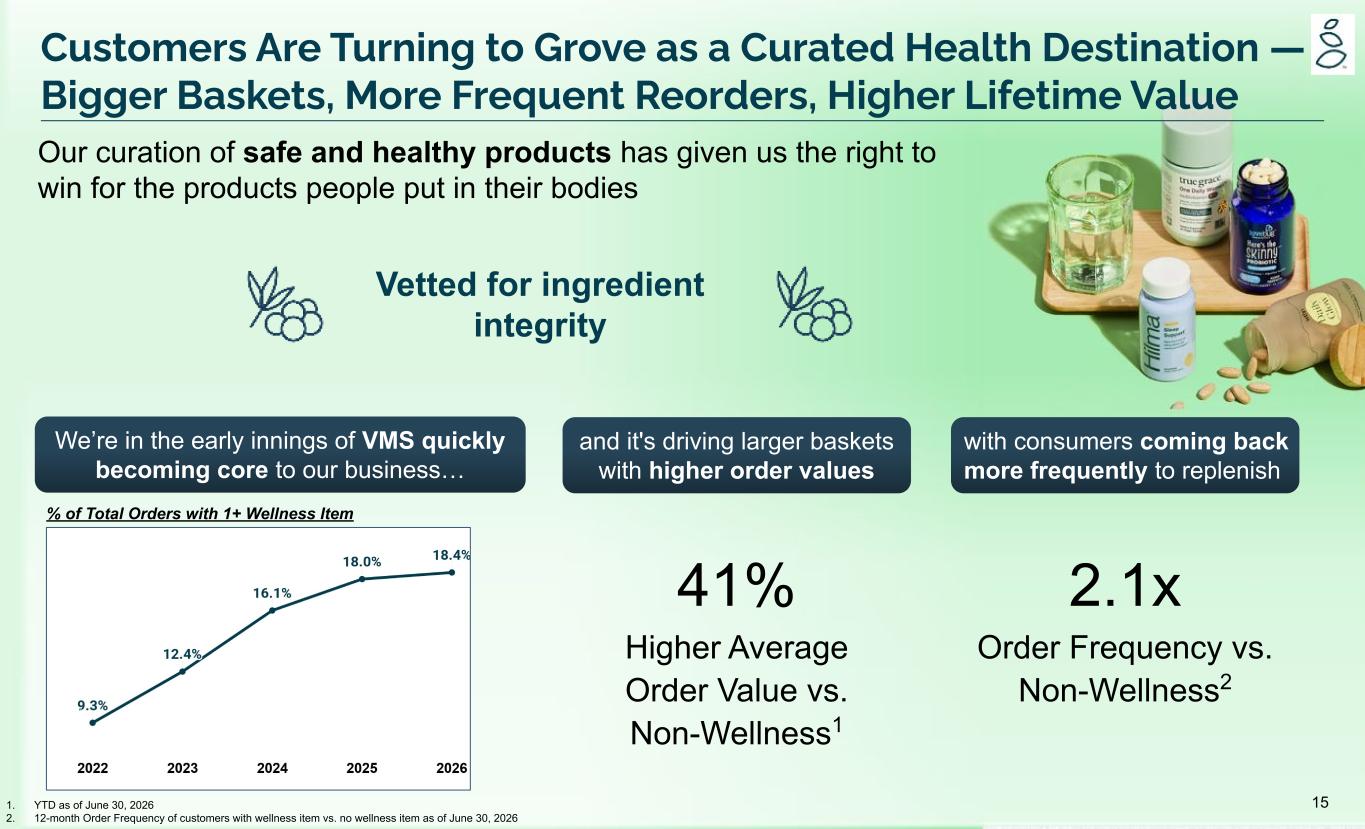
15 Vetted for ingredient integrity We’re in the early innings of VMS quickly becoming core to our business… % of Total Orders with 1+ Wellness Item and it's driving larger baskets with higher order values with consumers coming back more frequently to replenish 41% Higher Average Order Value vs. Non-Wellness1 2.1x Order Frequency vs. Non-Wellness2 1. YTD as of June 30, 2026 2. 12-month Order Frequency of customers with wellness item vs. no wellness item as of June 30, 2026 Customers Are Turning to Grove as a Curated Health Destination — Bigger Baskets, More Frequent Reorders, Higher Lifetime Value Our curation of safe and healthy products has given us the right to win for the products people put in their bodies
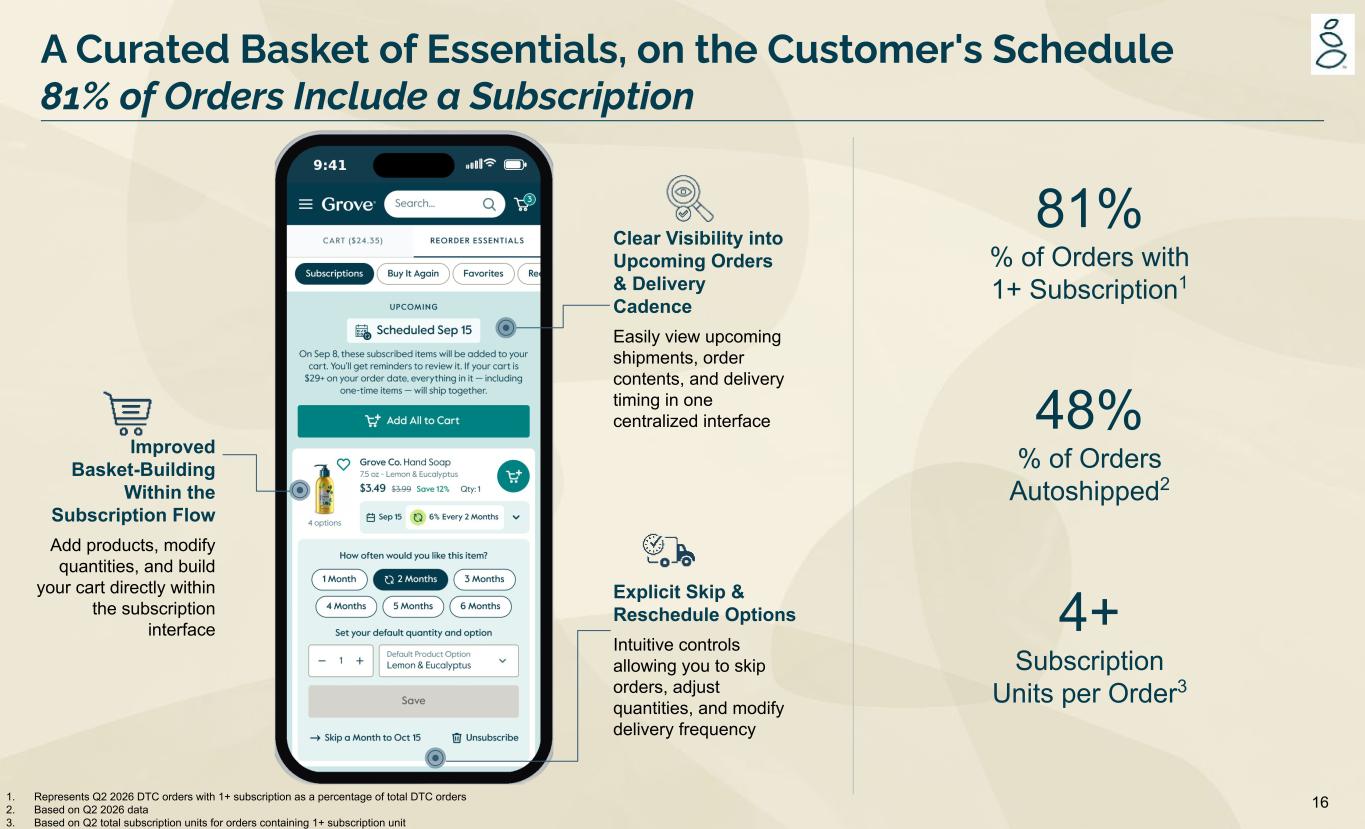
161. Represents Q2 2026 DTC orders with 1+ subscription as a percentage of total DTC orders 2. Based on Q2 2026 data 3. Based on Q2 total subscription units for orders containing 1+ subscription unit Clear Visibility into Upcoming Orders & Delivery Cadence Easily view upcoming shipments, order contents, and delivery timing in one centralized interface Improved Basket-Building Within the Subscription Flow Add products, modify quantities, and build your cart directly within the subscription interface Explicit Skip & Reschedule Options Intuitive controls allowing you to skip orders, adjust quantities, and modify delivery frequency 48% % of Orders Autoshipped2 4+ Subscription Units per Order3 81% % of Orders with 1+ Subscription1 A Curated Basket of Essentials, on the Customer's Schedule 81% of Orders Include a Subscription
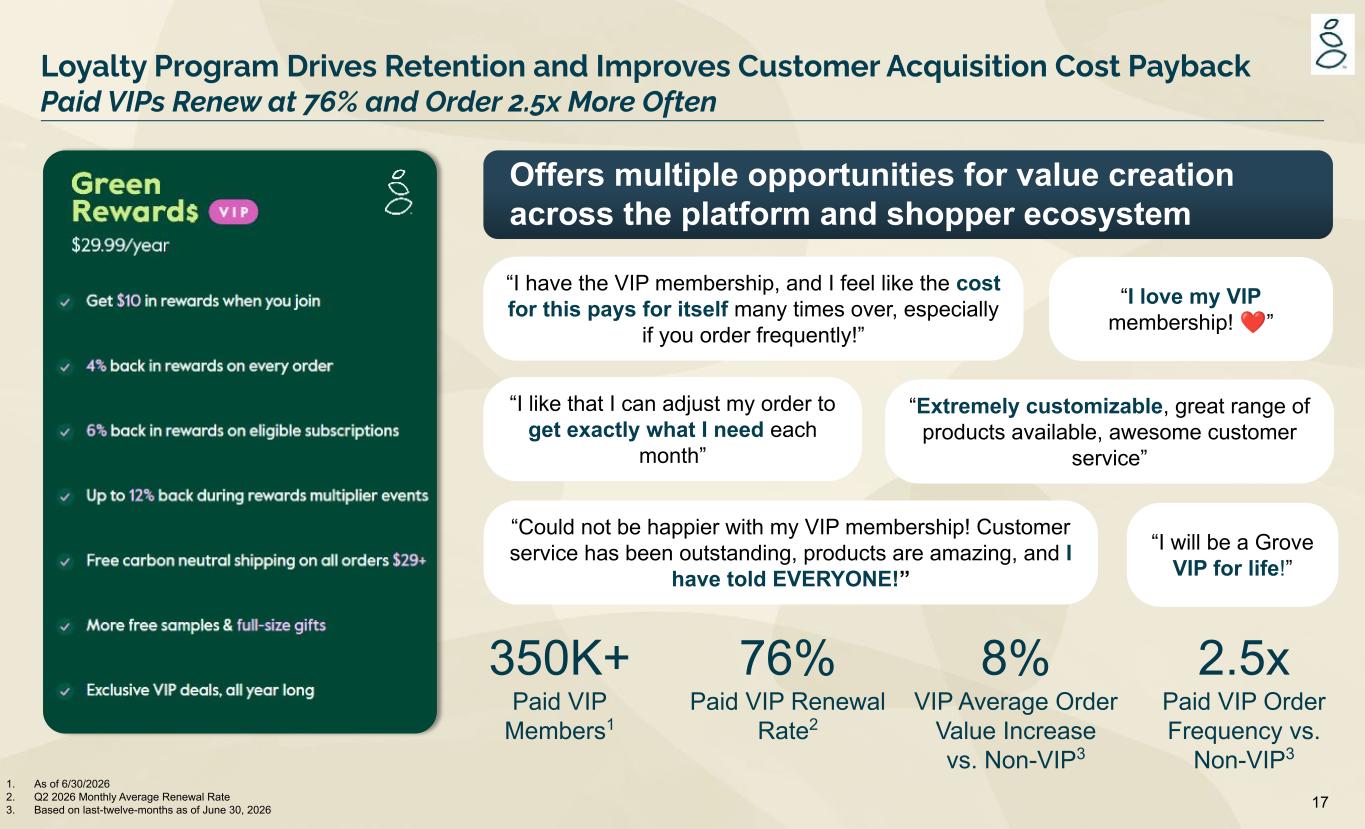
17 Loyalty Program Drives Retention and Improves Customer Acquisition Cost Payback Paid VIPs Renew at 76% and Order 2.5x More Often Notes: (1) Calculated as the percent of first order customers that convert to Paid VIP within 35 days 350K+ Paid VIP Members1 76% Paid VIP Renewal Rate2 8% VIP Average Order Value Increase vs. Non-VIP3 2.5x Paid VIP Order Frequency vs. Non-VIP3 “I have the VIP membership, and I feel like the cost for this pays for itself many times over, especially if you order frequently!” “Extremely customizable, great range of products available, awesome customer service” “I love my VIP membership! ❤” “I will be a Grove VIP for life!” “ “Could not be happier with my VIP membership! Customer service has been outstanding, products are amazing, and I have told EVERYONE!” “I like that I can adjust my order to get exactly what I need each month” 1. As of 6/30/2026 2. Q2 2026 Monthly Average Renewal Rate 3. Based on last-twelve-months as of June 30, 2026 Offers multiple opportunities for value creation across the platform and shopper ecosystem
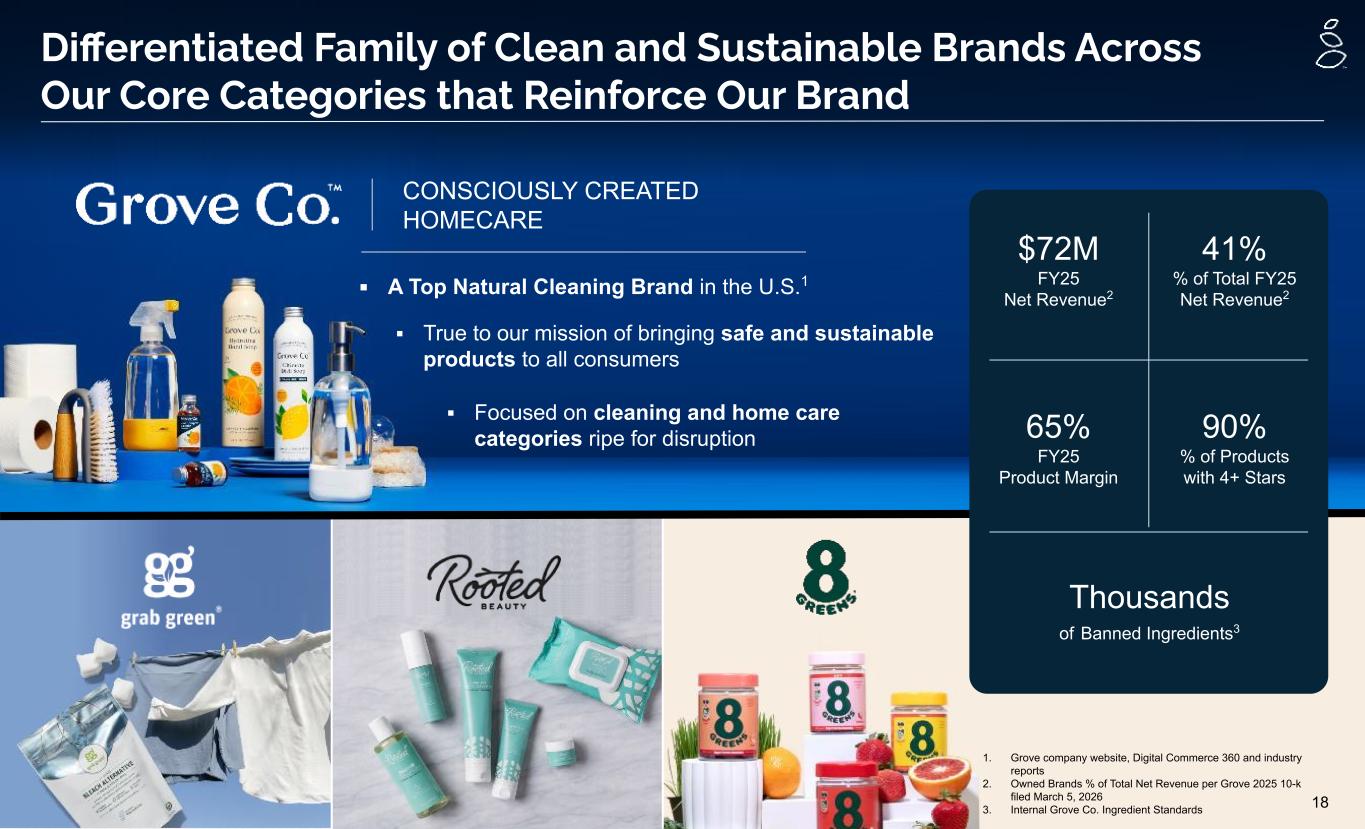
18 Differentiated Family of Clean and Sustainable Brands Across Our Core Categories that Reinforce Our Brand CONSCIOUSLY CREATED HOMECARE ▪ True to our mission of bringing safe and sustainable products to all consumers ▪ Focused on cleaning and home care categories ripe for disruption 1. Grove company website, Digital Commerce 360 and industry reports 2. Owned Brands % of Total Net Revenue per Grove 2025 10-k filed March 5, 2026 3. Internal Grove Co. Ingredient Standards Thousands of Banned Ingredients3 65% FY25 Product Margin 41% % of Total FY25 Net Revenue2 $72M FY25 Net Revenue2 90% % of Products with 4+ Stars ▪ A Top Natural Cleaning Brand in the U.S.1
MEASURING OUR IMPACT Q2 2026 Financial results
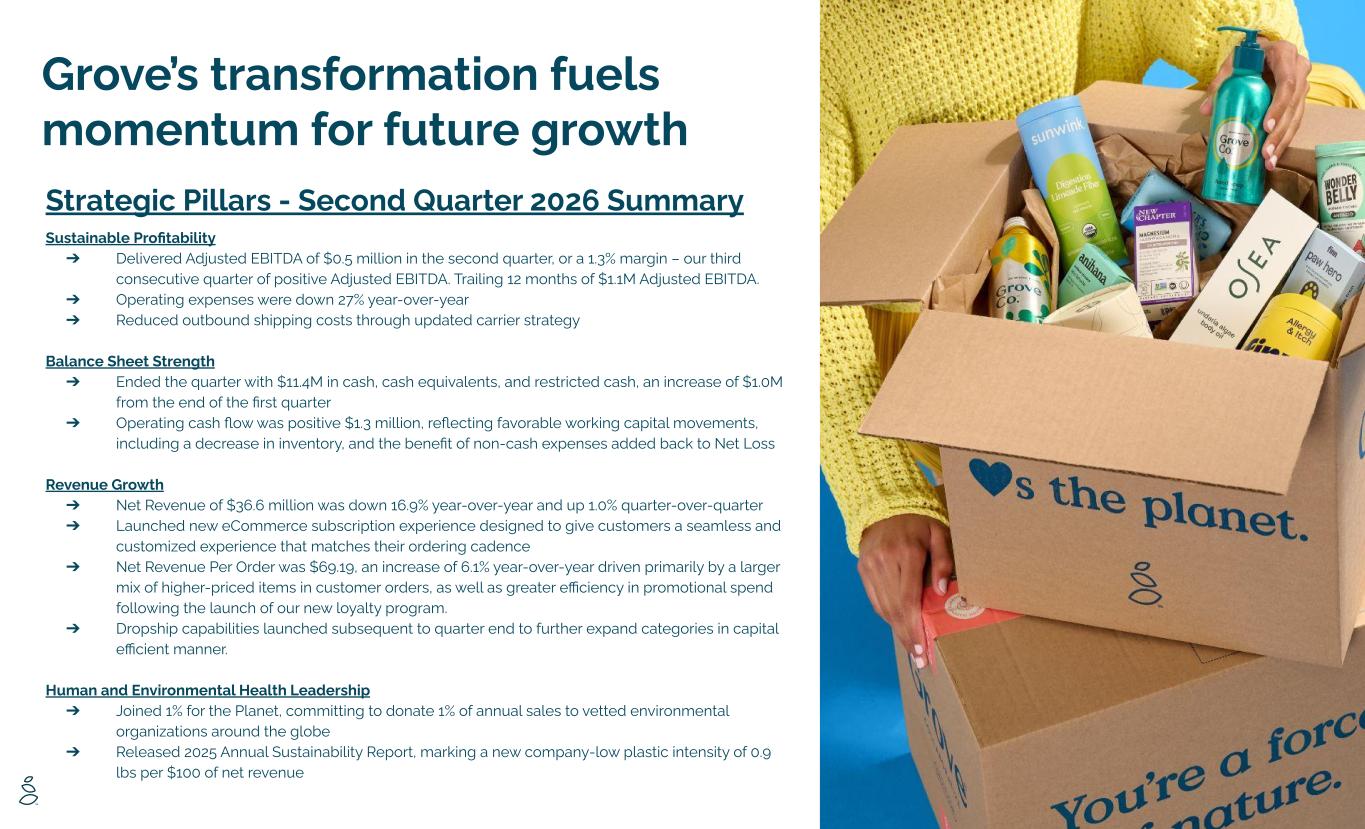
Strategic Pillars - Second Quarter 2026 Summary Sustainable Profitability ➔ Delivered Adjusted EBITDA of $0.5 million in the second quarter, or a 1.3% margin – our third consecutive quarter of positive Adjusted EBITDA. Trailing 12 months of $1.1M Adjusted EBITDA. ➔ Operating expenses were down 27% year-over-year ➔ Reduced outbound shipping costs through updated carrier strategy Balance Sheet Strength ➔ Ended the quarter with $11.4M in cash, cash equivalents, and restricted cash, an increase of $1.0M from the end of the first quarter ➔ Operating cash flow was positive $1.3 million, reflecting favorable working capital movements, including a decrease in inventory, and the benefit of non-cash expenses added back to Net Loss Revenue Growth ➔ Net Revenue of $36.6 million was down 16.9% year-over-year and up 1.0% quarter-over-quarter ➔ Launched new eCommerce subscription experience designed to give customers a seamless and customized experience that matches their ordering cadence ➔ Net Revenue Per Order was $69.19, an increase of 6.1% year-over-year driven primarily by a larger mix of higher-priced items in customer orders, as well as greater efficiency in promotional spend following the launch of our new loyalty program. ➔ Dropship capabilities launched subsequent to quarter end to further expand categories in capital efficient manner. Human and Environmental Health Leadership ➔ Joined 1% for the Planet, committing to donate 1% of annual sales to vetted environmental organizations around the globe ➔ Released 2025 Annual Sustainability Report, marking a new company-low plastic intensity of 0.9 lbs per $100 of net revenue Grove’s transformation fuels momentum for future growth
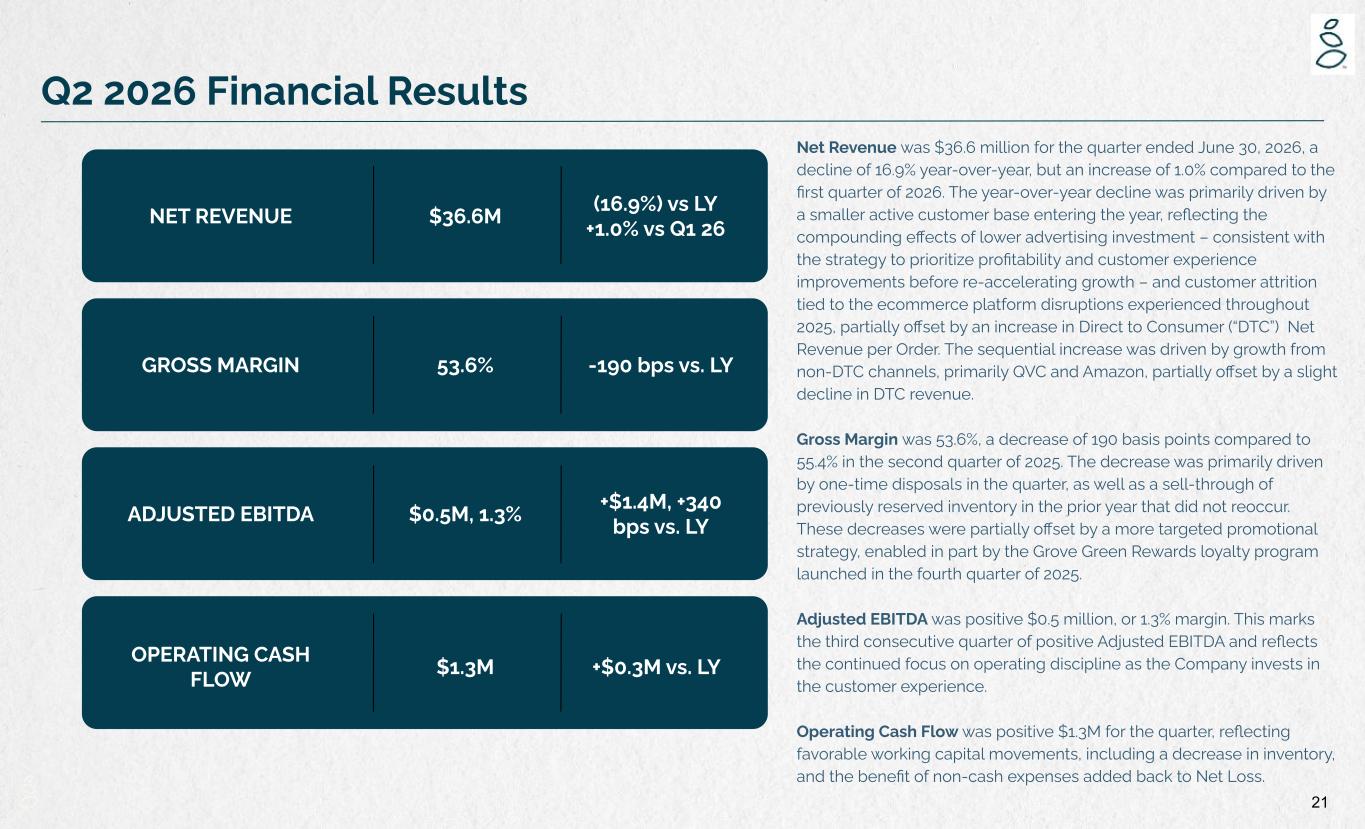
21 Q2 2026 Financial Results ADJUSTED EBITDA GROSS MARGIN NET REVENUE $36.6M (16.9%) vs LY +1.0% vs Q1 26 53.6% -190 bps vs. LY $0.5M, 1.3% +$1.4M, +340 bps vs. LY $1.3M +$0.3M vs. LYOPERATING CASH FLOW Net Revenue was $36.6 million for the quarter ended June 30, 2026, a decline of 16.9% year-over-year, but an increase of 1.0% compared to the first quarter of 2026. The year-over-year decline was primarily driven by a smaller active customer base entering the year, reflecting the compounding effects of lower advertising investment – consistent with the strategy to prioritize profitability and customer experience improvements before re-accelerating growth – and customer attrition tied to the ecommerce platform disruptions experienced throughout 2025, partially offset by an increase in Direct to Consumer (“DTC”) Net Revenue per Order. The sequential increase was driven by growth from non-DTC channels, primarily QVC and Amazon, partially offset by a slight decline in DTC revenue. Gross Margin was 53.6%, a decrease of 190 basis points compared to 55.4% in the second quarter of 2025. The decrease was primarily driven by one-time disposals in the quarter, as well as a sell-through of previously reserved inventory in the prior year that did not reoccur. These decreases were partially offset by a more targeted promotional strategy, enabled in part by the Grove Green Rewards loyalty program launched in the fourth quarter of 2025. Adjusted EBITDA was positive $0.5 million, or 1.3% margin. This marks the third consecutive quarter of positive Adjusted EBITDA and reflects the continued focus on operating discipline as the Company invests in the customer experience. Operating Cash Flow was positive $1.3M for the quarter, reflecting favorable working capital movements, including a decrease in inventory, and the benefit of non-cash expenses added back to Net Loss.
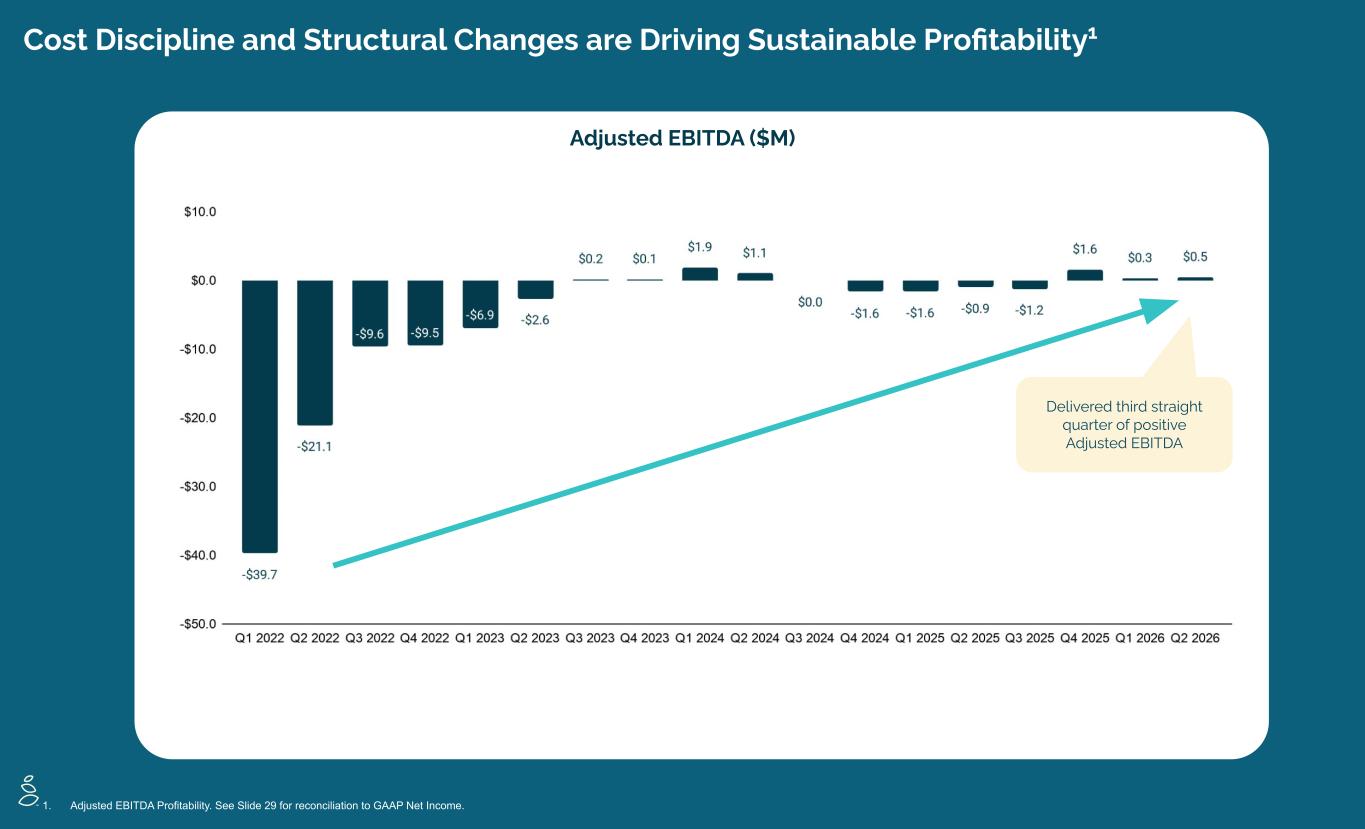
Cost Discipline and Structural Changes are Driving Sustainable Profitability1 Adjusted EBITDA ($M) Delivered third straight quarter of positive Adjusted EBITDA 1. Adjusted EBITDA Profitability. See Slide 29 for reconciliation to GAAP Net Income.
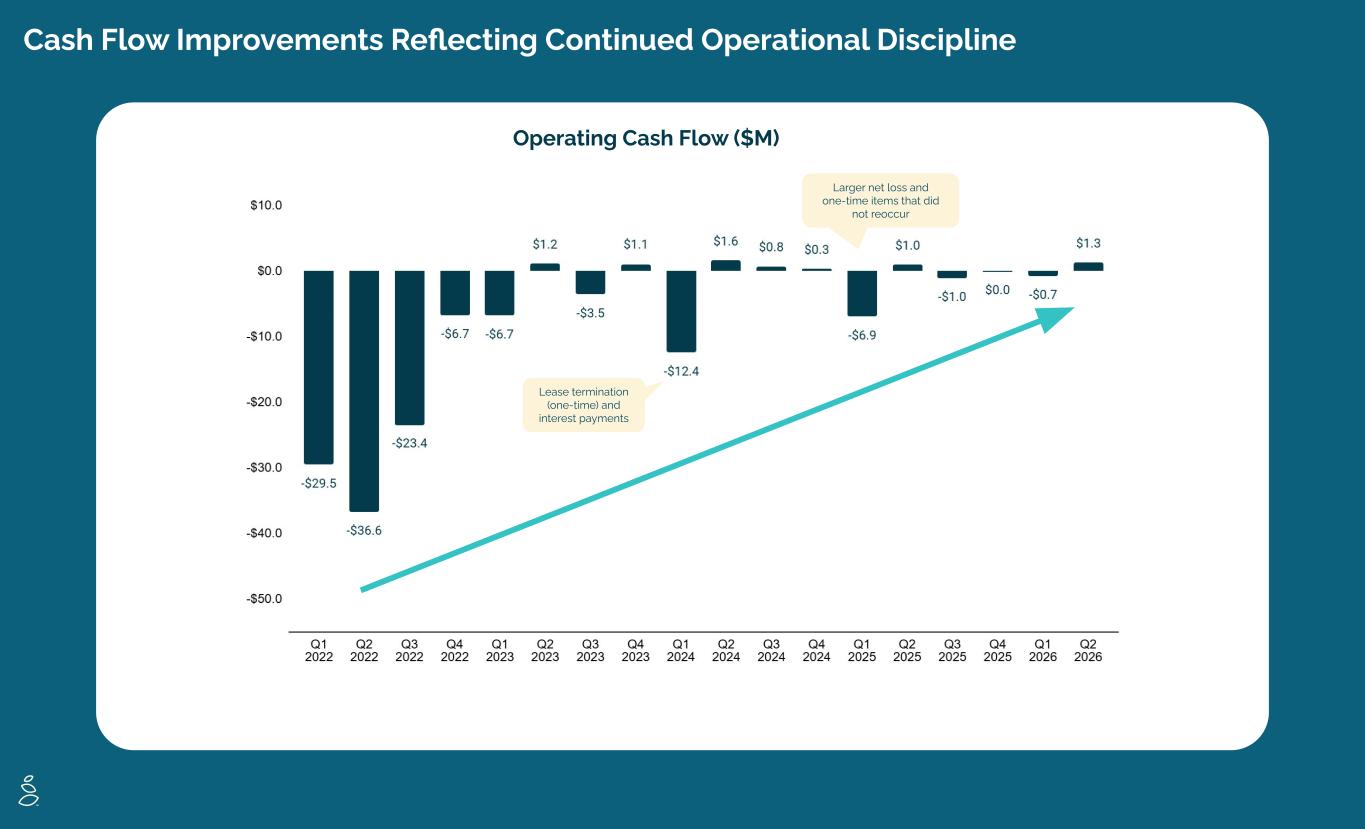
Cash Flow Improvements Reflecting Continued Operational Discipline Operating Cash Flow ($M) Larger net loss and one-time items that did not reoccur Lease termination (one-time) and interest payments
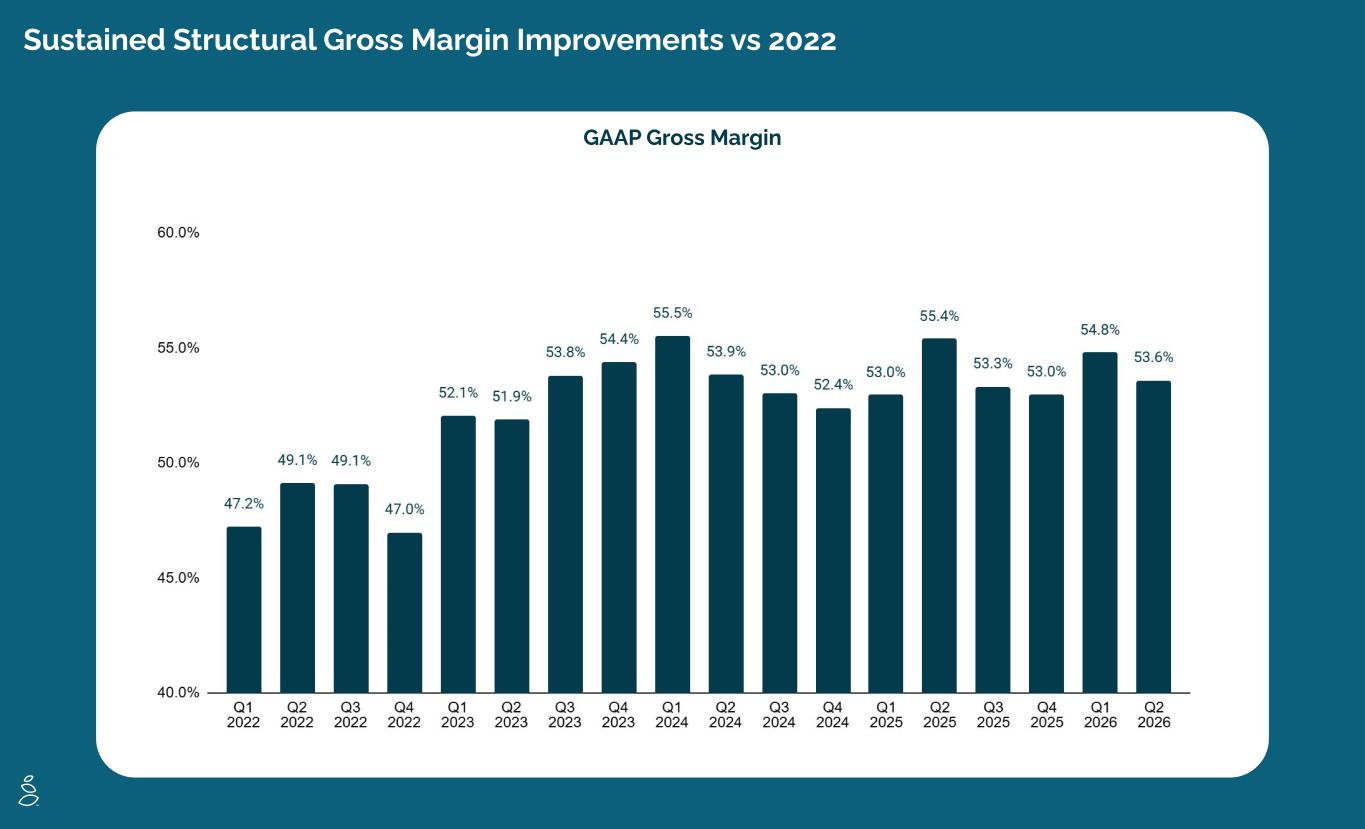
Sustained Structural Gross Margin Improvements vs 2022 GAAP Gross Margin
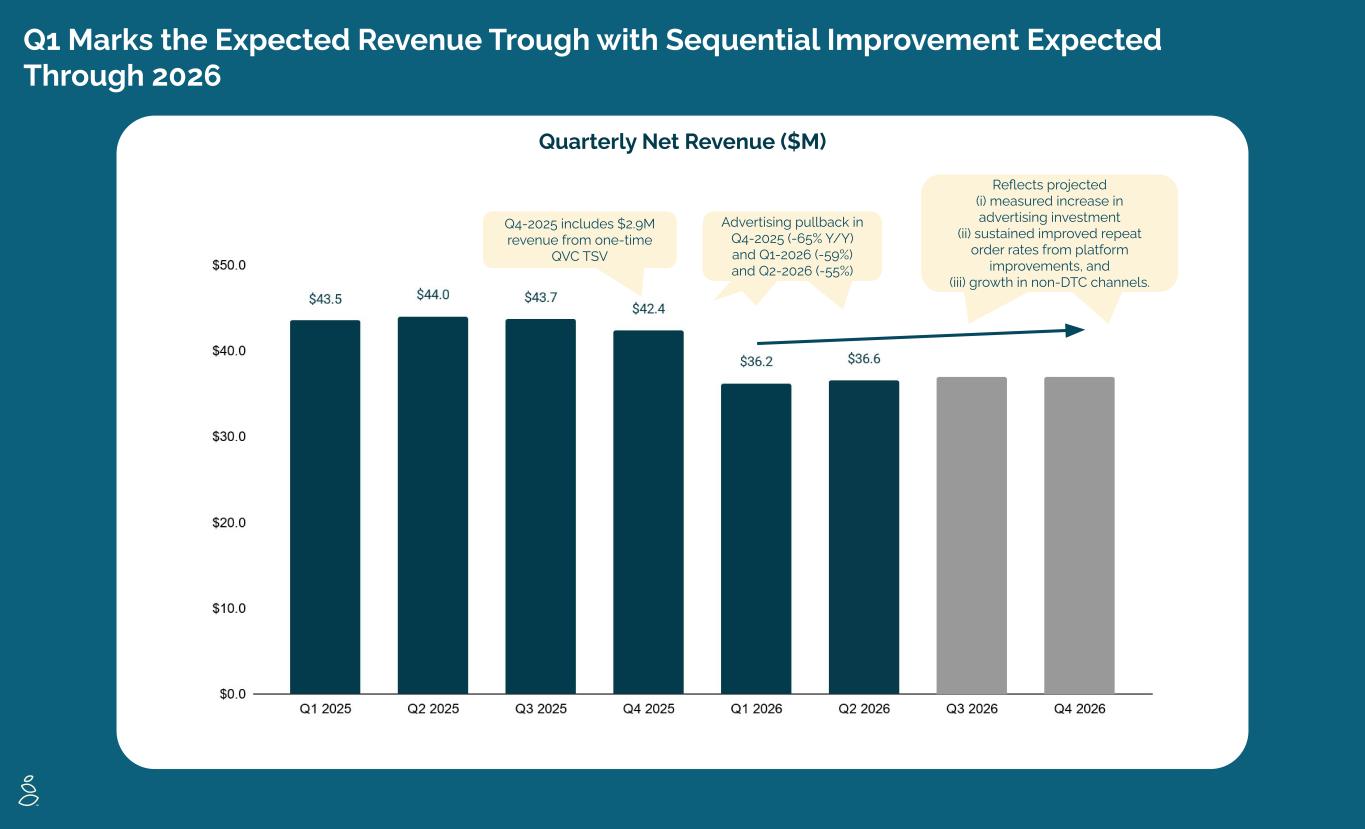
Q1 Marks the Expected Revenue Trough with Sequential Improvement Expected Through 2026 Quarterly Net Revenue ($M) Q4-2025 includes $2.9M revenue from one-time QVC TSV Advertising pullback in Q4-2025 (-65% Y/Y) and Q1-2026 (-59%) rti i ll in Q4-2025 (-65% Y/Y) and Q1-2026 (-59%) and Q2-2026 (-55%) Measured increase in advertising investment, and improved repeat order rates from platform improvements Reflects projected (i) measured increase in advertising investment (ii) sustained improved repeat order rates from platform improvements, and (iii) growth in non-DTC channels.
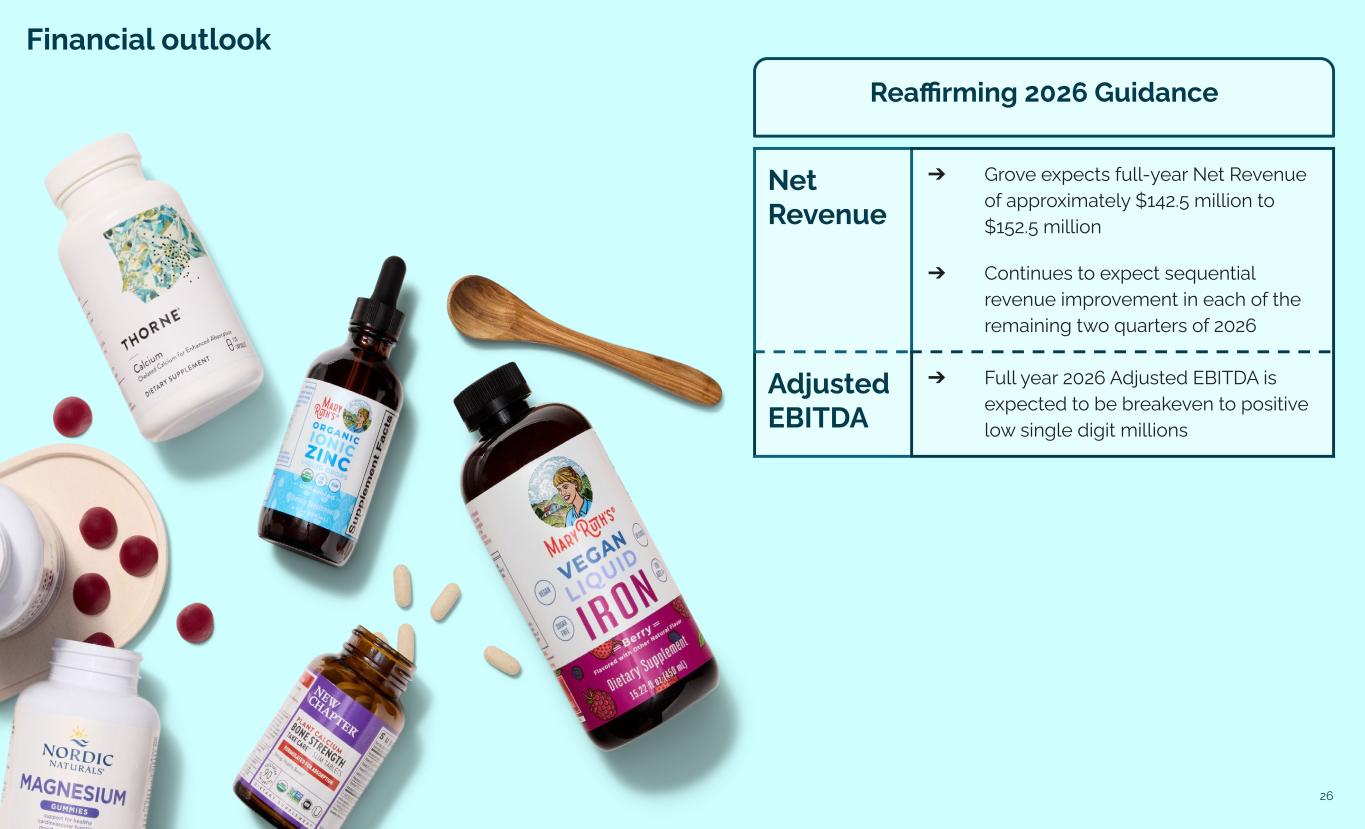
26 Financial outlook Net Revenue ➔ Grove expects full-year Net Revenue of approximately $142.5 million to $152.5 million ➔ Continues to expect sequential revenue improvement in each of the remaining two quarters of 2026 Adjusted EBITDA ➔ Full year 2026 Adjusted EBITDA is expected to be breakeven to positive low single digit millions Reaffirming 2026 Guidance
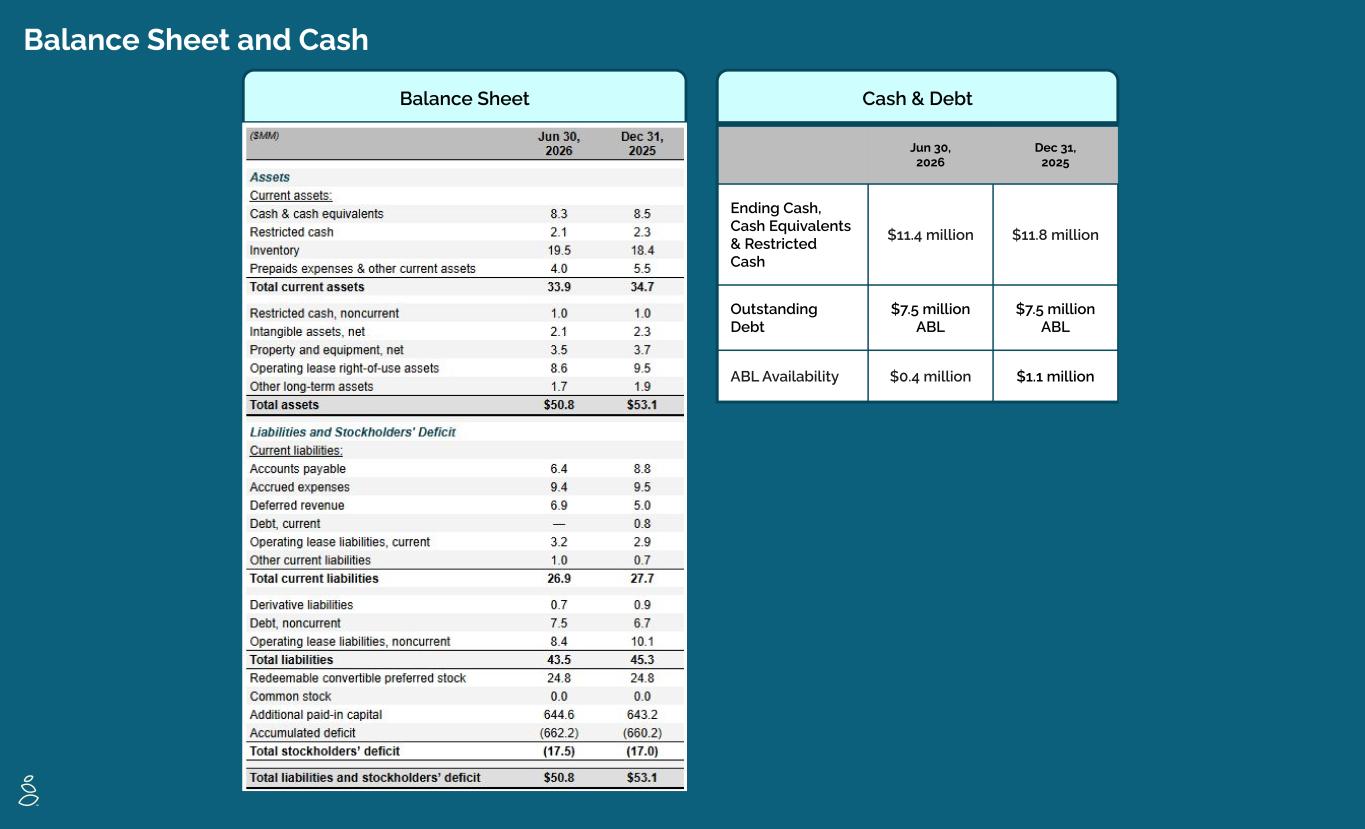
Balance Sheet and Cash Balance Sheet Cash & Debt Jun 30, 2026 Dec 31, 2025 Ending Cash, Cash Equivalents & Restricted Cash $11.4 million $11.8 million Outstanding Debt $7.5 million ABL $7.5 million ABL ABL Availability $0.4 million $1.1 million
Appendix
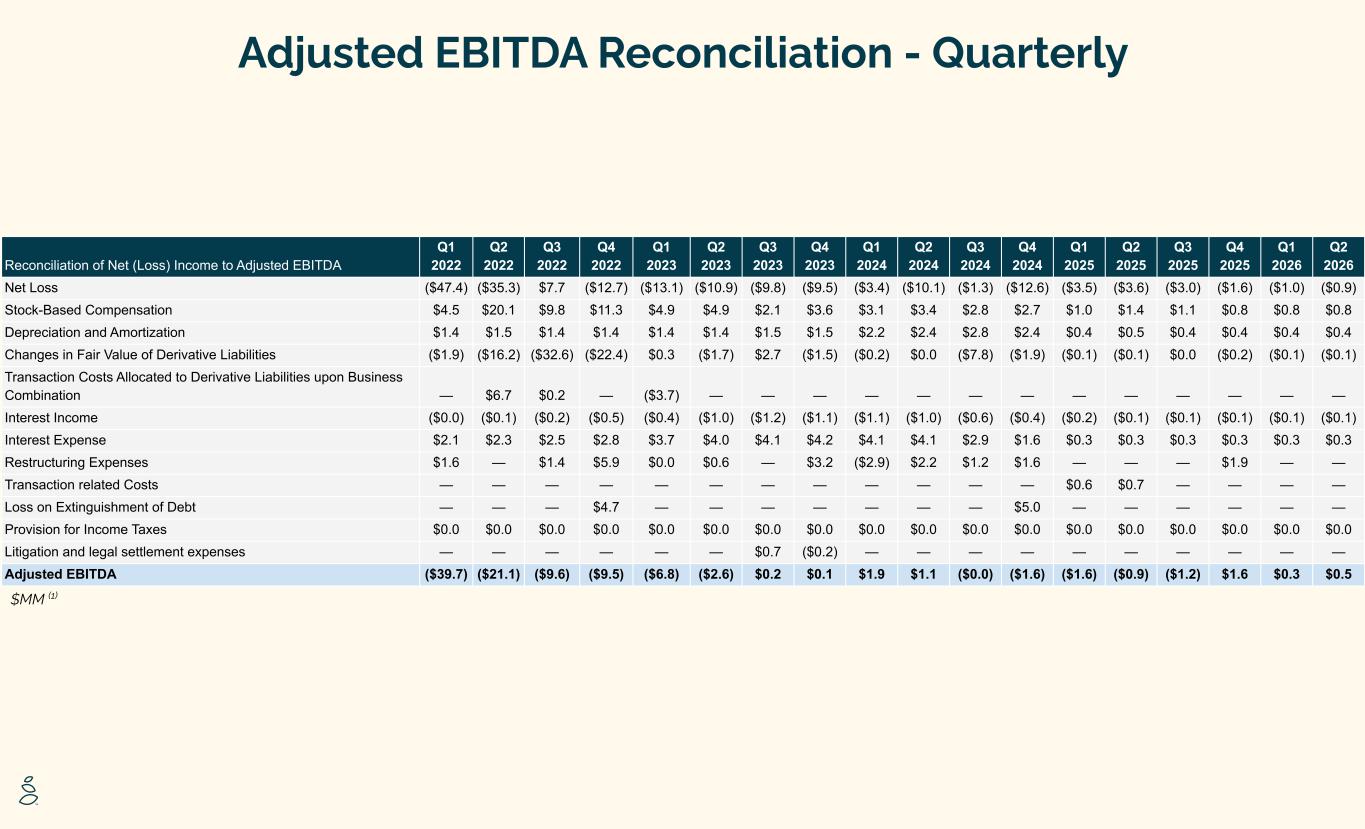
Adjusted EBITDA Reconciliation - Quarterly $MM (1) Reconciliation of Net (Loss) Income to Adjusted EBITDA Q1 2022 Q2 2022 Q3 2022 Q4 2022 Q1 2023 Q2 2023 Q3 2023 Q4 2023 Q1 2024 Q2 2024 Q3 2024 Q4 2024 Q1 2025 Q2 2025 Q3 2025 Q4 2025 Q1 2026 Q2 2026 Net Loss ($47.4) ($35.3) $7.7 ($12.7) ($13.1) ($10.9) ($9.8) ($9.5) ($3.4) ($10.1) ($1.3) ($12.6) ($3.5) ($3.6) ($3.0) ($1.6) ($1.0) ($0.9) Stock-Based Compensation $4.5 $20.1 $9.8 $11.3 $4.9 $4.9 $2.1 $3.6 $3.1 $3.4 $2.8 $2.7 $1.0 $1.4 $1.1 $0.8 $0.8 $0.8 Depreciation and Amortization $1.4 $1.5 $1.4 $1.4 $1.4 $1.4 $1.5 $1.5 $2.2 $2.4 $2.8 $2.4 $0.4 $0.5 $0.4 $0.4 $0.4 $0.4 Changes in Fair Value of Derivative Liabilities ($1.9) ($16.2) ($32.6) ($22.4) $0.3 ($1.7) $2.7 ($1.5) ($0.2) $0.0 ($7.8) ($1.9) ($0.1) ($0.1) $0.0 ($0.2) ($0.1) ($0.1) Transaction Costs Allocated to Derivative Liabilities upon Business Combination — $6.7 $0.2 — ($3.7) — — — — — — — — — — — — — Interest Income ($0.0) ($0.1) ($0.2) ($0.5) ($0.4) ($1.0) ($1.2) ($1.1) ($1.1) ($1.0) ($0.6) ($0.4) ($0.2) ($0.1) ($0.1) ($0.1) ($0.1) ($0.1) Interest Expense $2.1 $2.3 $2.5 $2.8 $3.7 $4.0 $4.1 $4.2 $4.1 $4.1 $2.9 $1.6 $0.3 $0.3 $0.3 $0.3 $0.3 $0.3 Restructuring Expenses $1.6 — $1.4 $5.9 $0.0 $0.6 — $3.2 ($2.9) $2.2 $1.2 $1.6 — — — $1.9 — — Transaction related Costs — — — — — — — — — — — — $0.6 $0.7 — — — — Loss on Extinguishment of Debt — — — $4.7 — — — — — — — $5.0 — — — — — — Provision for Income Taxes $0.0 $0.0 $0.0 $0.0 $0.0 $0.0 $0.0 $0.0 $0.0 $0.0 $0.0 $0.0 $0.0 $0.0 $0.0 $0.0 $0.0 $0.0 Litigation and legal settlement expenses — — — — — — $0.7 ($0.2) — — — — — — — — — — Adjusted EBITDA ($39.7) ($21.1) ($9.6) ($9.5) ($6.8) ($2.6) $0.2 $0.1 $1.9 $1.1 ($0.0) ($1.6) ($1.6) ($0.9) ($1.2) $1.6 $0.3 $0.5
30 home, family, planet, healthier. Your
31