Q4 and Fiscal Year 2022
2 Forward-Looking Statements / Non-GAAP Financial Measures Forward-Looking Statements This presentation contains forward-looking statements within the “safe harbor” provisions of the Private Securities Litigation Reform Act of 1995. All statements other than those that are purely historical are forward-looking statements. Forward-looking statements include statements identified as such in our March 14, 2023 press release. Because these forward-looking statements involve risks and uncertainties, there are important factors that could cause our actual results to differ materially from those in the forward-looking statements. Additional information regarding factors that could cause results to differ can be found in the Company’s Annual Report on Form 10-k for the year ended December 31, 2022, as well as the Company’s subsequent filings with the Securities and Exchange Commission. These forward-looking statements are based on information as of March 14, 2023. We assume no obligation to publicly update or revise our forward-looking statements even if experience or future changes make it clear that any projected results expressed or implied therein will not be realized. SEC Regulation G This presentation includes the non-GAAP measure Adjusted EBITDA. The description and reconciliation of this measure from GAAP is included in our March 14, 2023 earnings press release, which is available on investors.grove.co.
Q4 2022 Business Highlights 3
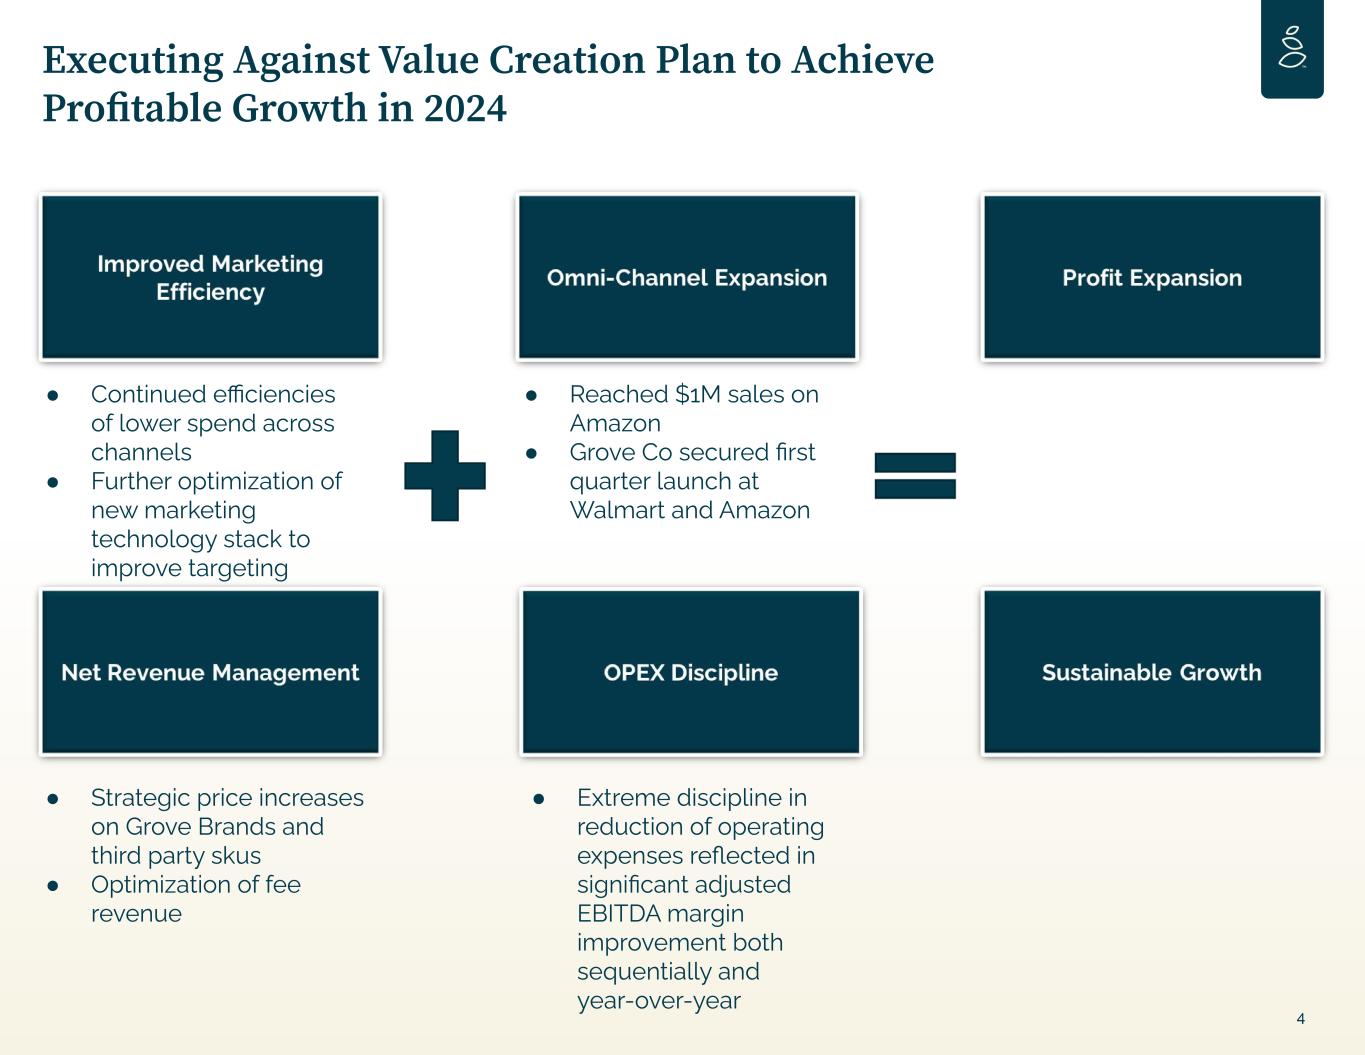
Executing Against Value Creation Plan to Achieve Profitable Growth in 2024 4 ● Continued efficiencies of lower spend across channels ● Further optimization of new marketing technology stack to improve targeting ● Reached $1M sales on Amazon ● Grove Co secured first quarter launch at Walmart and Amazon ● Strategic price increases on Grove Brands and third party skus ● Optimization of fee revenue ● Extreme discipline in reduction of operating expenses reflected in significant adjusted EBITDA margin improvement both sequentially and year-over-year

New Product Launches 5 Fresh Horizons New collection launched in partnership with Drew Barrymore
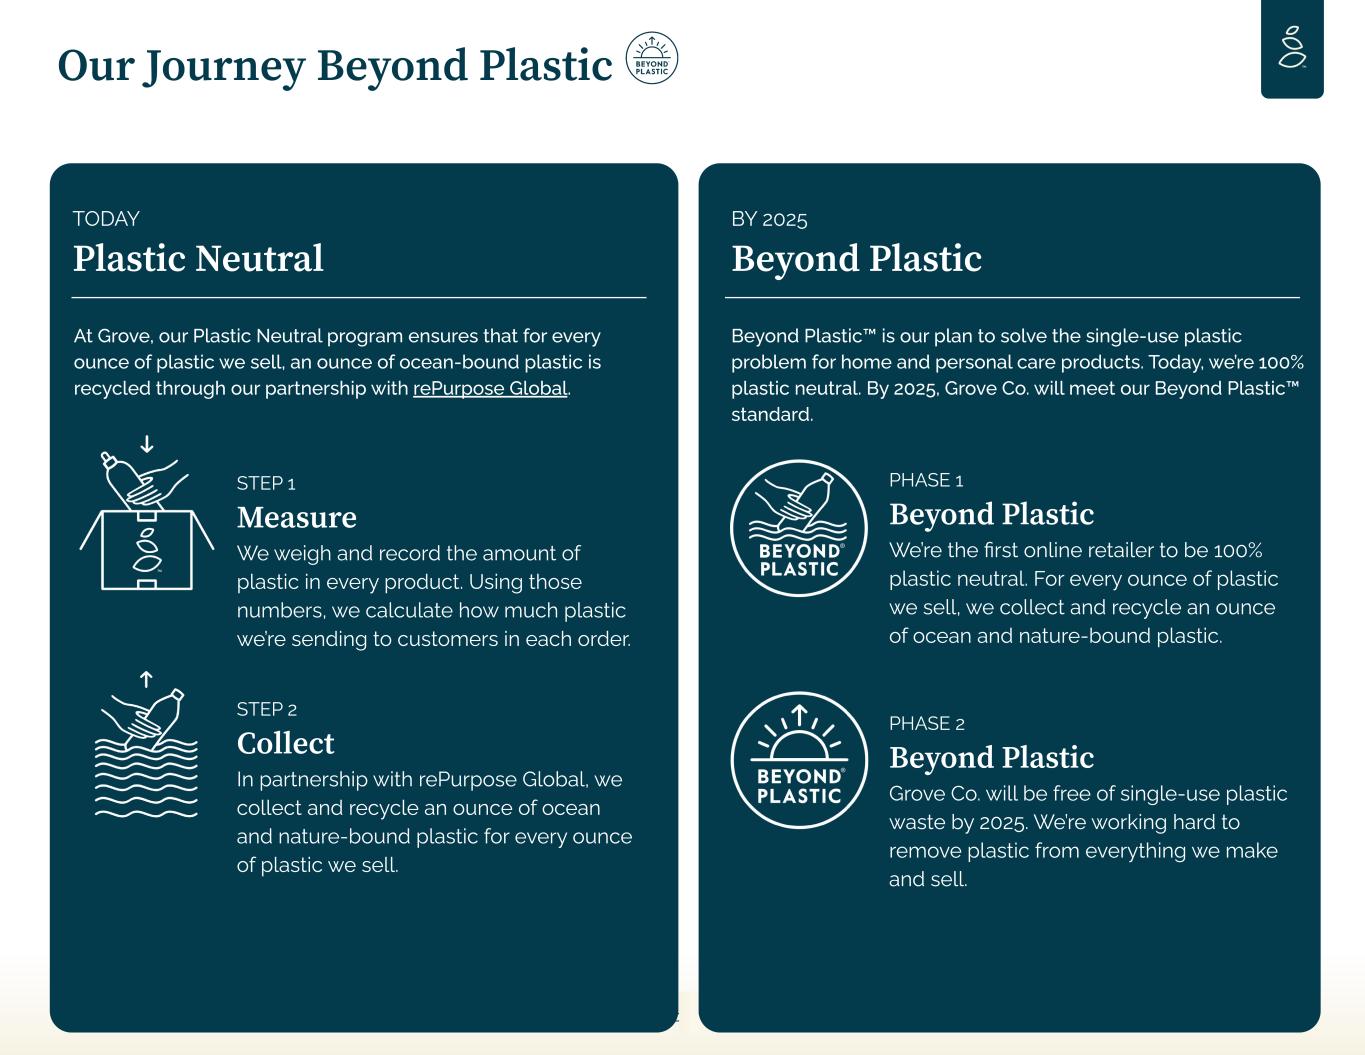
GROVE COLLABORATIVE CONFIDENTIAL Our Journey Beyond Plastic TODAY Plastic Neutral At Grove, our Plastic Neutral program ensures that for every ounce of plastic we sell, an ounce of ocean-bound plastic is recycled through our partnership with rePurpose Global. STEP 1 Measure We weigh and record the amount of plastic in every product. Using those numbers, we calculate how much plastic we’re sending to customers in each order. STEP 2 Collect In partnership with rePurpose Global, we collect and recycle an ounce of ocean and nature-bound plastic for every ounce of plastic we sell. BY 2025 Beyond Plastic Beyond Plastic™ is our plan to solve the single-use plastic problem for home and personal care products. Today, we’re 100% plastic neutral. By 2025, Grove Co. will meet our Beyond Plastic™ standard. PHASE 1 Beyond Plastic We’re the first online retailer to be 100% plastic neutral. For every ounce of plastic we sell, we collect and recycle an ounce of ocean and nature-bound plastic. PHASE 2 Beyond Plastic Grove Co. will be free of single-use plastic waste by 2025. We’re working hard to remove plastic from everything we make and sell. 6
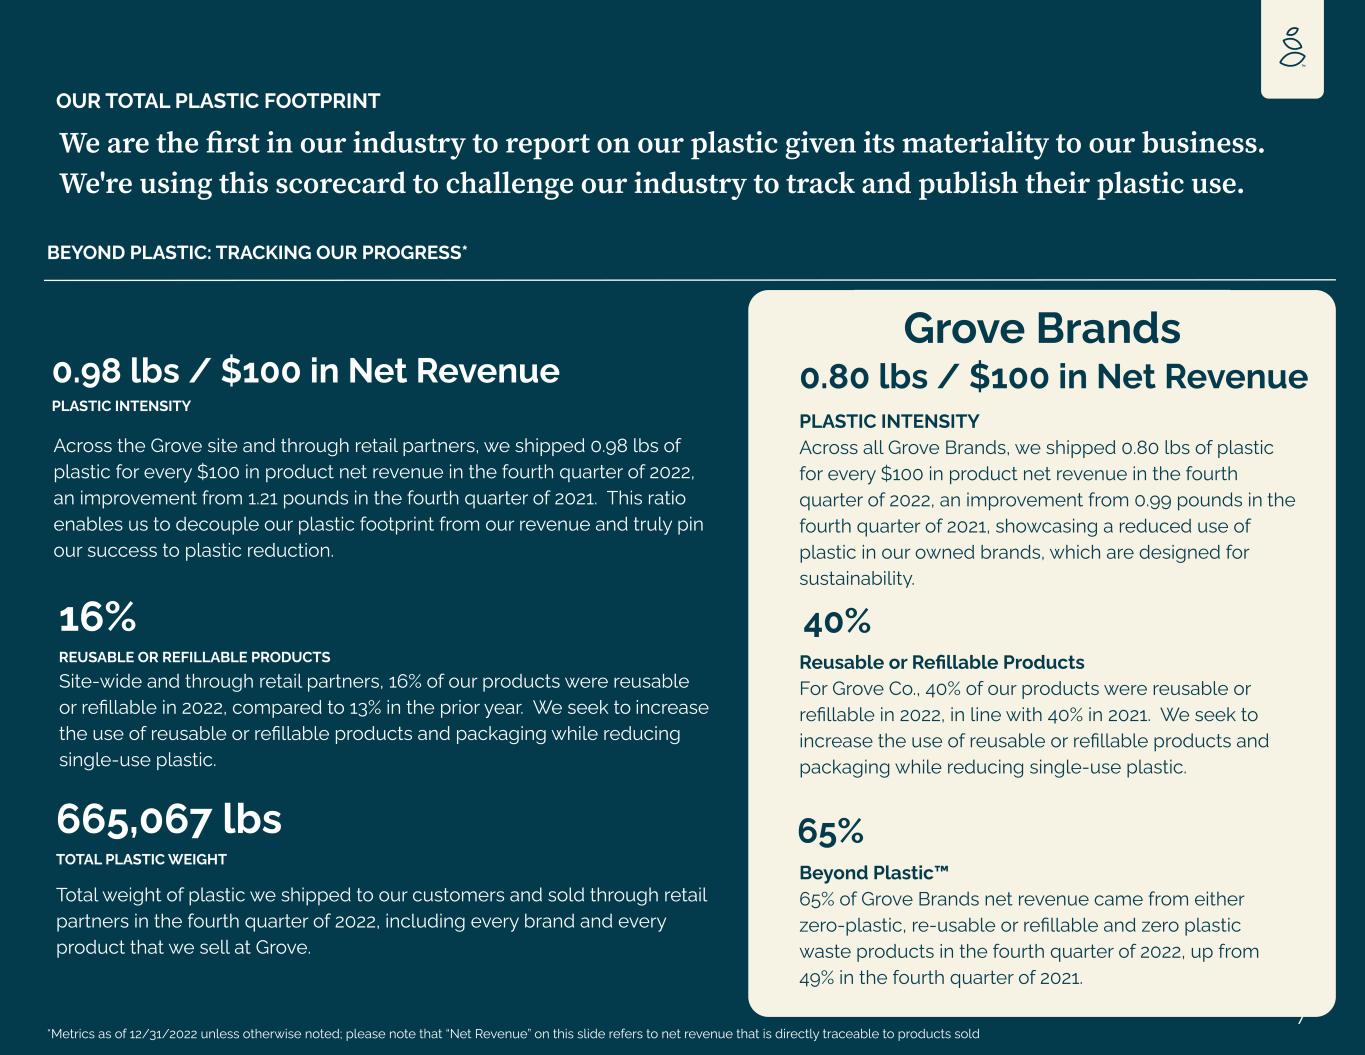
77 OUR TOTAL PLASTIC FOOTPRINT BEYOND PLASTIC: TRACKING OUR PROGRESS* We are the first in our industry to report on our plastic given its materiality to our business. We're using this scorecard to challenge our industry to track and publish their plastic use. 665,067 lbs TOTAL PLASTIC WEIGHT Total weight of plastic we shipped to our customers and sold through retail partners in the fourth quarter of 2022, including every brand and every product that we sell at Grove. *Metrics as of 12/31/2022 unless otherwise noted; please note that “Net Revenue” on this slide refers to net revenue that is directly traceable to products sold Beyond Plastic™ 65% of Grove Brands net revenue came from either zero-plastic, re-usable or refillable and zero plastic waste products in the fourth quarter of 2022, up from 49% in the fourth quarter of 2021. 65% Grove Brands Across the Grove site and through retail partners, we shipped 0.98 lbs of plastic for every $100 in product net revenue in the fourth quarter of 2022, an improvement from 1.21 pounds in the fourth quarter of 2021. This ratio enables us to decouple our plastic footprint from our revenue and truly pin our success to plastic reduction. 0.98 lbs / $100 in Net Revenue PLASTIC INTENSITY PLASTIC INTENSITY Across all Grove Brands, we shipped 0.80 lbs of plastic for every $100 in product net revenue in the fourth quarter of 2022, an improvement from 0.99 pounds in the fourth quarter of 2021, showcasing a reduced use of plastic in our owned brands, which are designed for sustainability. 0.80 lbs / $100 in Net Revenue Site-wide and through retail partners, 16% of our products were reusable or refillable in 2022, compared to 13% in the prior year. We seek to increase the use of reusable or refillable products and packaging while reducing single-use plastic. 16% REUSABLE OR REFILLABLE PRODUCTS Reusable or Refillable Products For Grove Co., 40% of our products were reusable or refillable in 2022, in line with 40% in 2021. We seek to increase the use of reusable or refillable products and packaging while reducing single-use plastic. 40%
Q4 and FY 2022 Financial Update 8
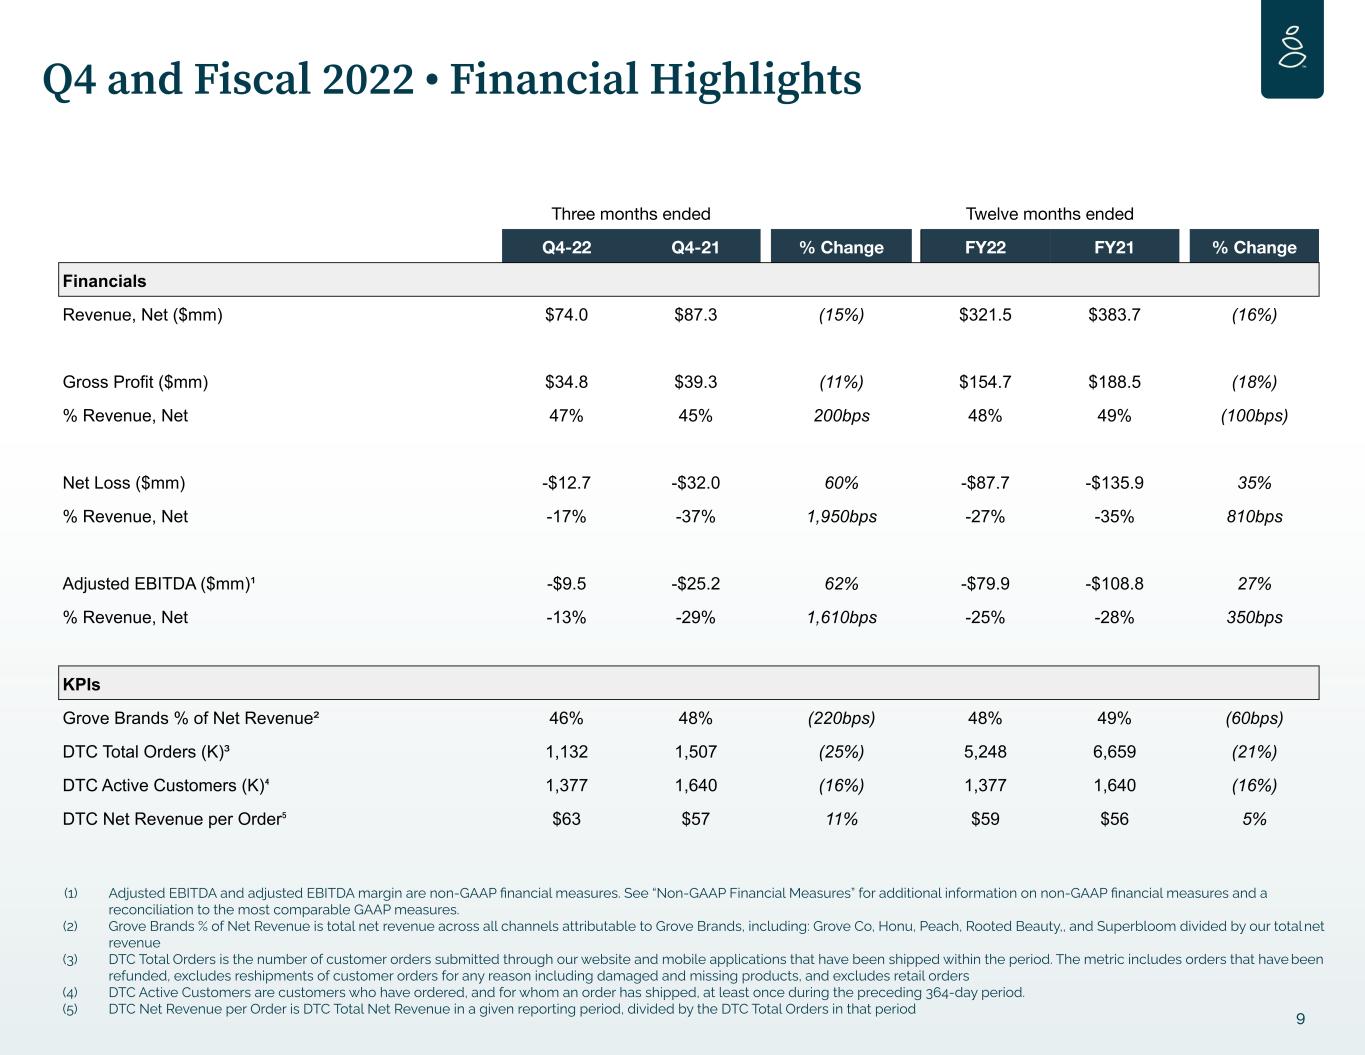
9 Q4 and Fiscal 2022 • Financial Highlights (1) Adjusted EBITDA and adjusted EBITDA margin are non-GAAP financial measures. See “Non-GAAP Financial Measures” for additional information on non-GAAP financial measures and a reconciliation to the most comparable GAAP measures. (2) Grove Brands % of Net Revenue is total net revenue across all channels attributable to Grove Brands, including: Grove Co, Honu, Peach, Rooted Beauty,, and Superbloom divided by our total net revenue (3) DTC Total Orders is the number of customer orders submitted through our website and mobile applications that have been shipped within the period. The metric includes orders that have been refunded, excludes reshipments of customer orders for any reason including damaged and missing products, and excludes retail orders (4) DTC Active Customers are customers who have ordered, and for whom an order has shipped, at least once during the preceding 364-day period. (5) DTC Net Revenue per Order is DTC Total Net Revenue in a given reporting period, divided by the DTC Total Orders in that period Three months ended Twelve months ended Q4-22 Q4-21 % Change FY22 FY21 % Change Financials Revenue, Net ($mm) $74.0 $87.3 (15%) $321.5 $383.7 (16%) Gross Profit ($mm) $34.8 $39.3 (11%) $154.7 $188.5 (18%) % Revenue, Net 47% 45% 200bps 48% 49% (100bps) Net Loss ($mm) -$12.7 -$32.0 60% -$87.7 -$135.9 35% % Revenue, Net -17% -37% 1,950bps -27% -35% 810bps Adjusted EBITDA ($mm)¹ -$9.5 -$25.2 62% -$79.9 -$108.8 27% % Revenue, Net -13% -29% 1,610bps -25% -28% 350bps KPIs Grove Brands % of Net Revenue² 46% 48% (220bps) 48% 49% (60bps) DTC Total Orders (K)³ 1,132 1,507 (25%) 5,248 6,659 (21%) DTC Active Customers (K)⁴ 1,377 1,640 (16%) 1,377 1,640 (16%) DTC Net Revenue per Order⁵ $63 $57 11% $59 $56 5%
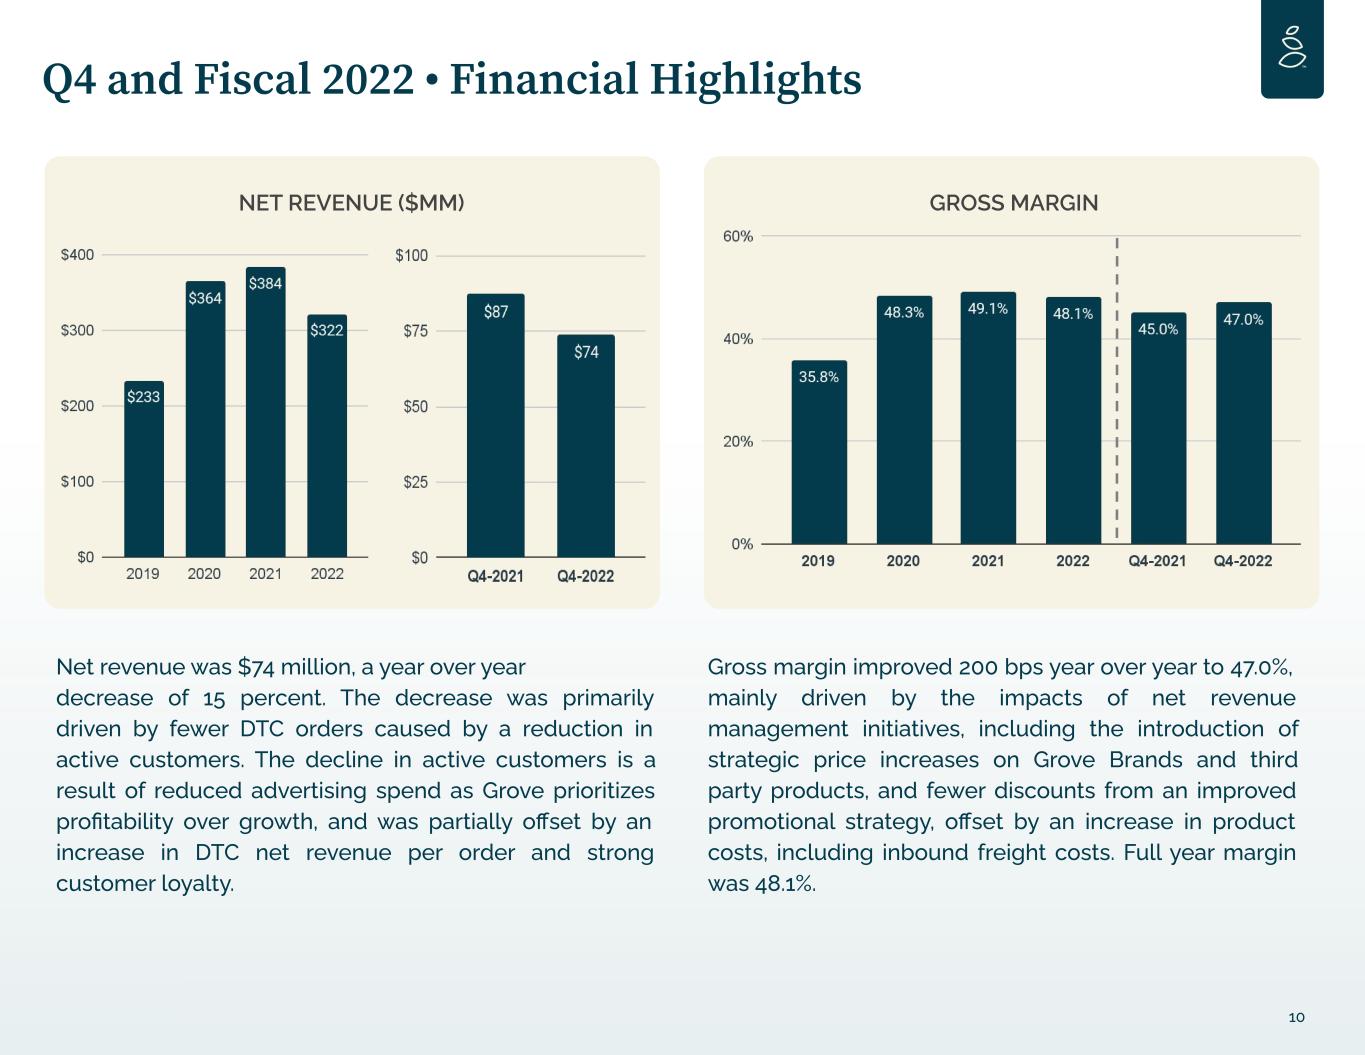
10 Q4 and Fiscal 2022 • Financial Highlights Net revenue was $74 million, a year over year decrease of 15 percent. The decrease was primarily driven by fewer DTC orders caused by a reduction in active customers. The decline in active customers is a result of reduced advertising spend as Grove prioritizes profitability over growth, and was partially offset by an increase in DTC net revenue per order and strong customer loyalty. Gross margin improved 200 bps year over year to 47.0%, mainly driven by the impacts of net revenue management initiatives, including the introduction of strategic price increases on Grove Brands and third party products, and fewer discounts from an improved promotional strategy, offset by an increase in product costs, including inbound freight costs. Full year margin was 48.1%. GROSS MARGIN NET REVENUE ($MM)
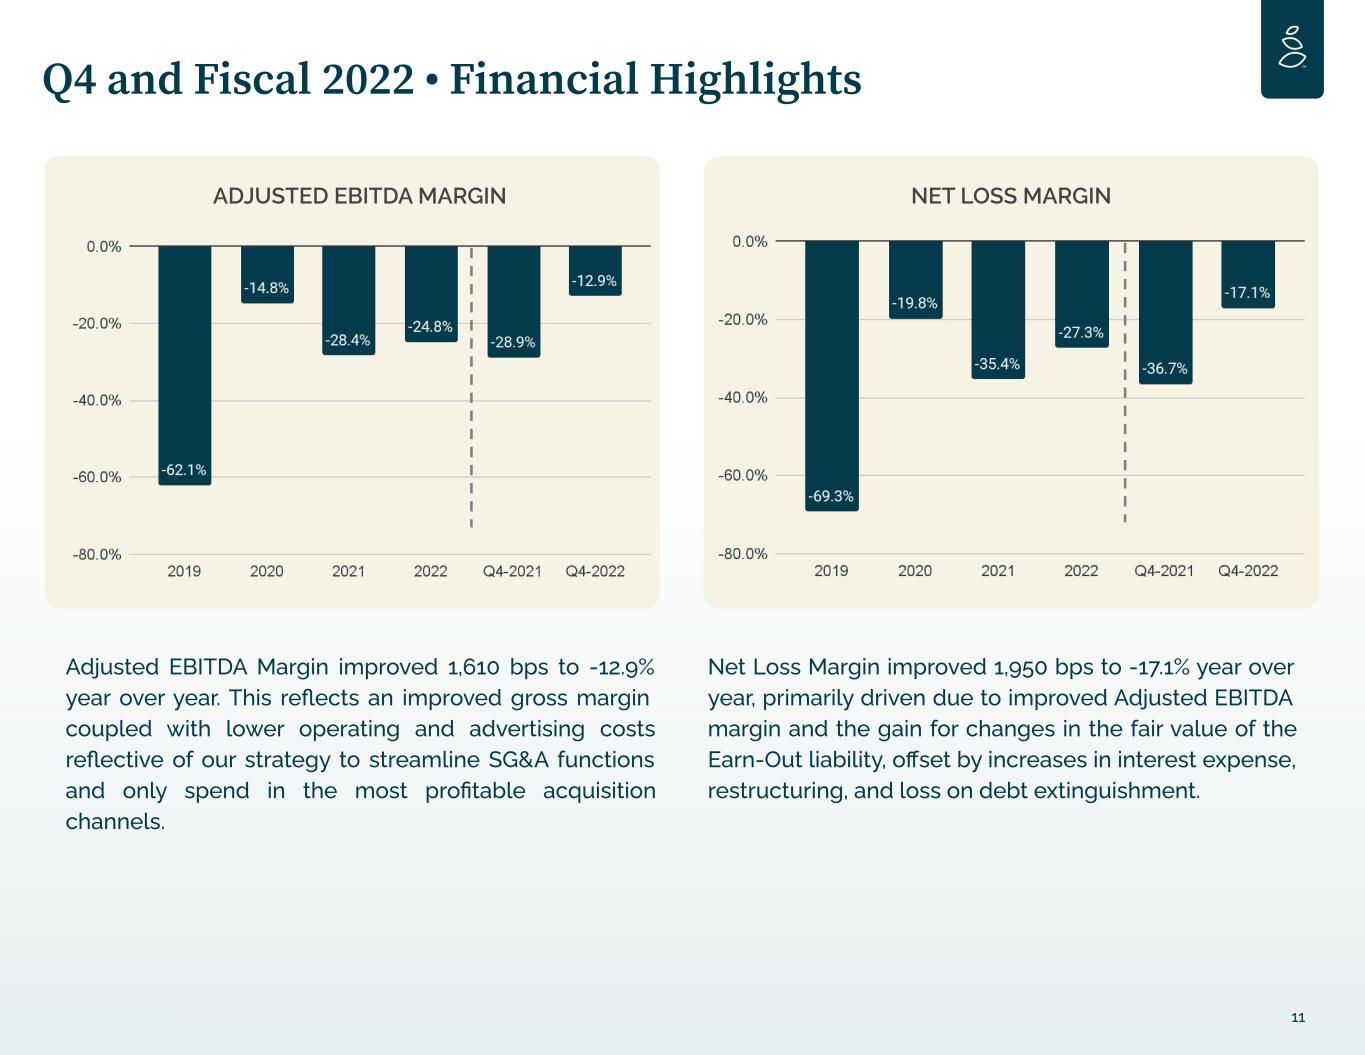
Adjusted EBITDA Margin improved 1,610 bps to -12.9% year over year. This reflects an improved gross margin coupled with lower operating and advertising costs reflective of our strategy to streamline SG&A functions and only spend in the most profitable acquisition channels. 11 Q4 and Fiscal 2022 • Financial Highlights ADJUSTED EBITDA MARGIN Net Loss Margin improved 1,950 bps to -17.1% year over year, primarily driven due to improved Adjusted EBITDA margin and the gain for changes in the fair value of the Earn-Out liability, offset by increases in interest expense, restructuring, and loss on debt extinguishment. NET LOSS MARGIN
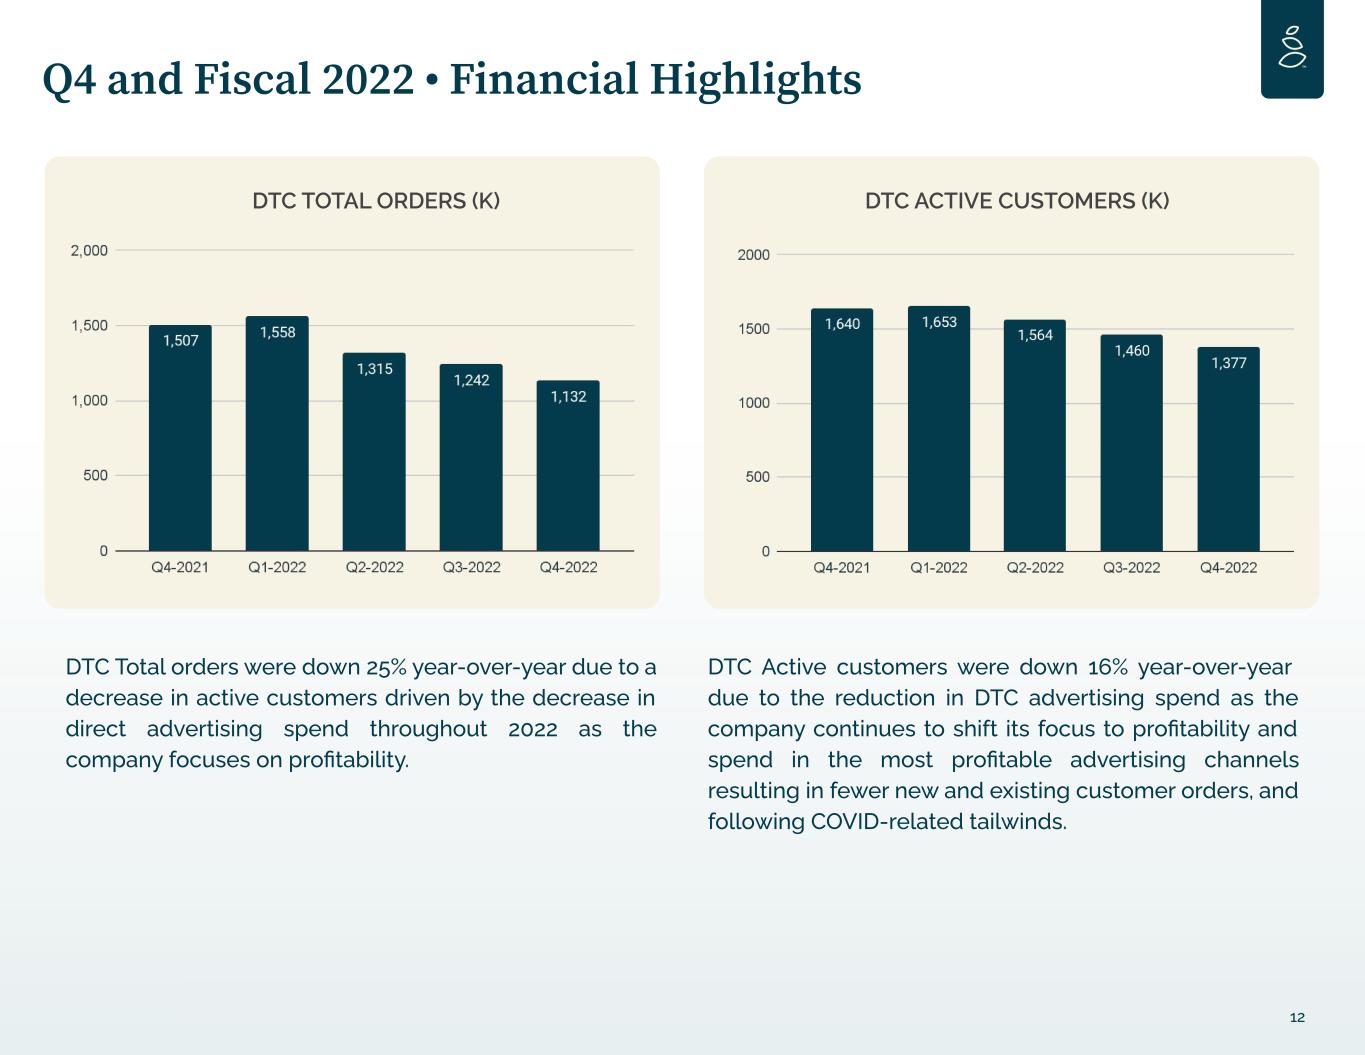
12 Q4 and Fiscal 2022 • Financial Highlights DTC Total orders were down 25% year-over-year due to a decrease in active customers driven by the decrease in direct advertising spend throughout 2022 as the company focuses on profitability. DTC Active customers were down 16% year-over-year due to the reduction in DTC advertising spend as the company continues to shift its focus to profitability and spend in the most profitable advertising channels resulting in fewer new and existing customer orders, and following COVID-related tailwinds. DTC ACTIVE CUSTOMERS (K)DTC TOTAL ORDERS (K)
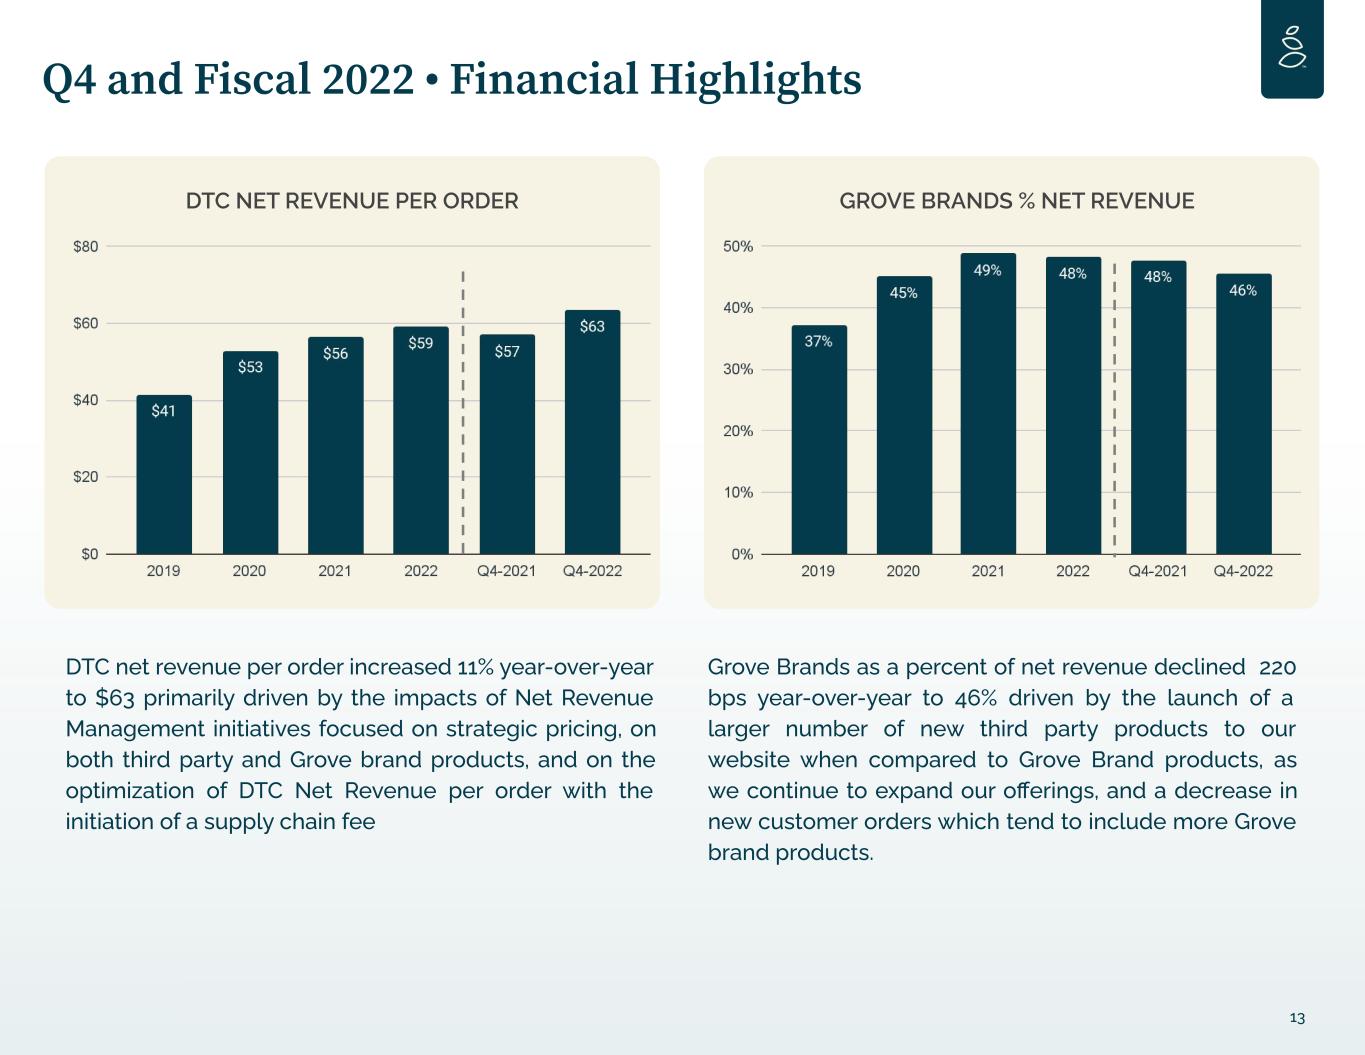
Grove Brands as a percent of net revenue declined 220 bps year-over-year to 46% driven by the launch of a larger number of new third party products to our website when compared to Grove Brand products, as we continue to expand our offerings, and a decrease in new customer orders which tend to include more Grove brand products. DTC net revenue per order increased 11% year-over-year to $63 primarily driven by the impacts of Net Revenue Management initiatives focused on strategic pricing, on both third party and Grove brand products, and on the optimization of DTC Net Revenue per order with the initiation of a supply chain fee 13 Q4 and Fiscal 2022 • Financial Highlights DTC NET REVENUE PER ORDER GROVE BRANDS % NET REVENUE
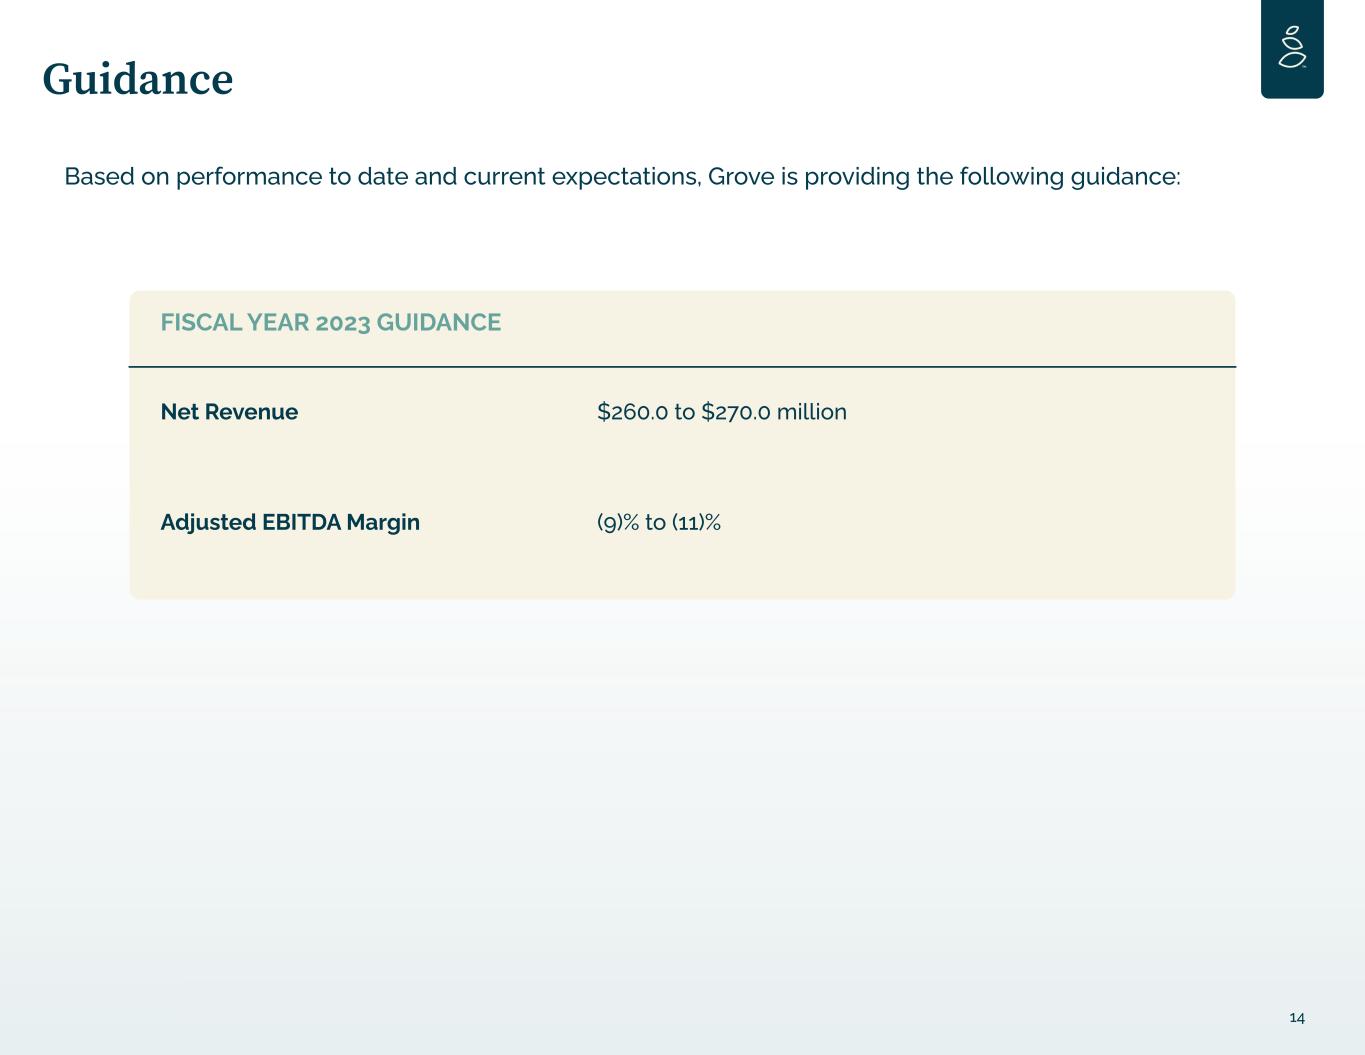
FISCAL YEAR 2023 GUIDANCE Net Revenue $260.0 to $270.0 million Adjusted EBITDA Margin (9)% to (11)% 14 Guidance Based on performance to date and current expectations, Grove is providing the following guidance:

Financial Statements 15
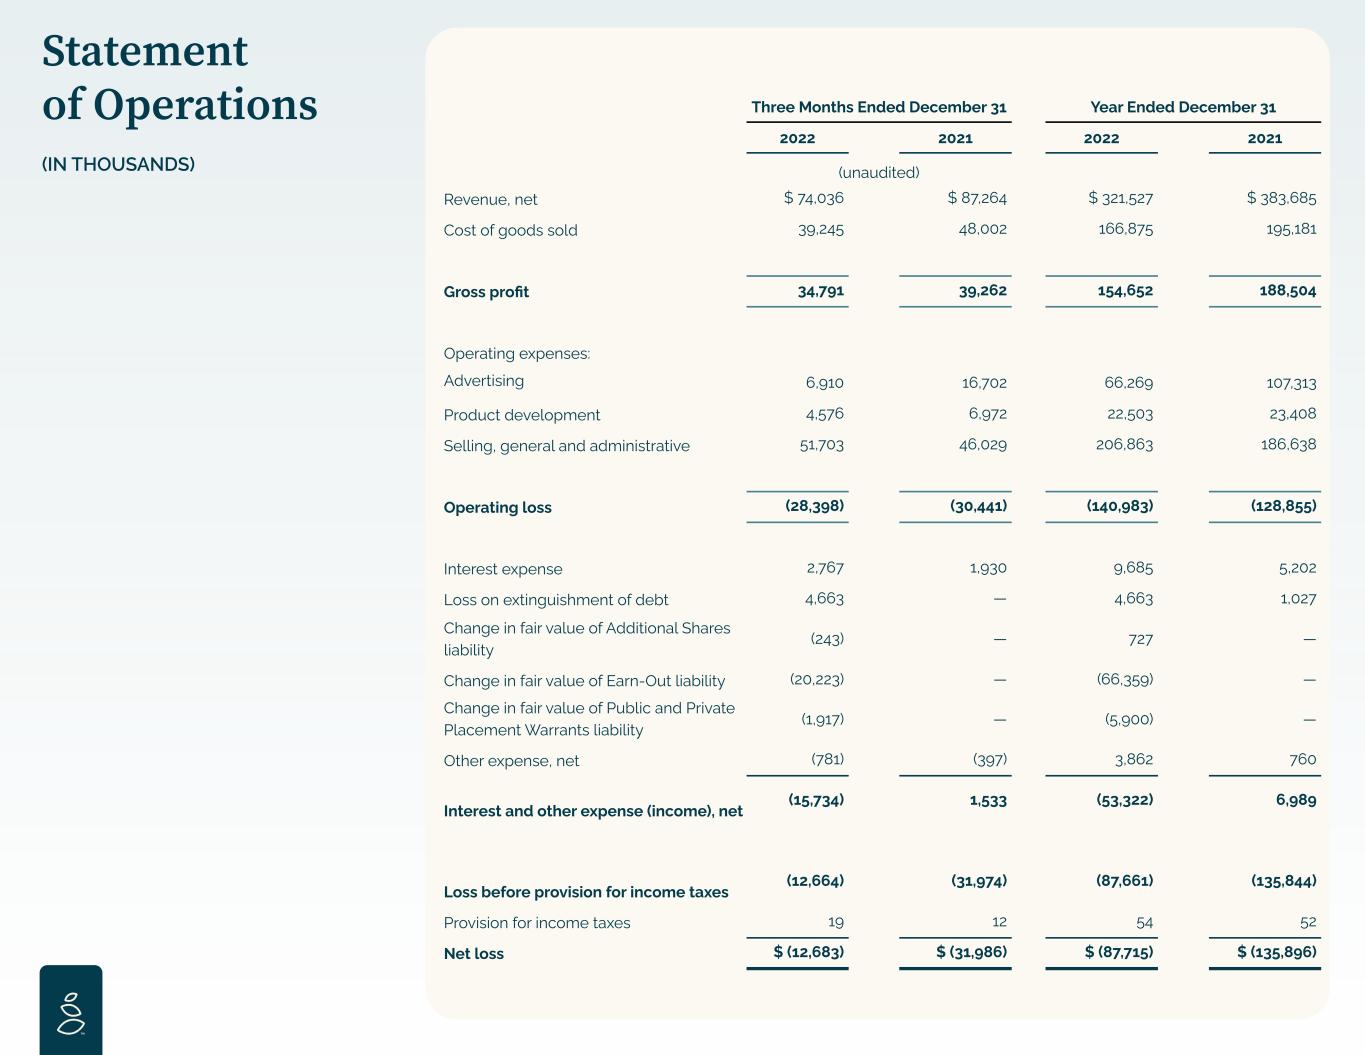
Statement of Operations (IN THOUSANDS) Three Months Ended December 31 Year Ended December 31 2022 2021 2022 2021 (unaudited) Revenue, net $ 74,036 $ 87,264 $ 321,527 $ 383,685 Cost of goods sold 39,245 48,002 166,875 195,181 Gross profit 34,791 39,262 154,652 188,504 Operating expenses: Advertising 6,910 16,702 66,269 107,313 Product development 4,576 6,972 22,503 23,408 Selling, general and administrative 51,703 46,029 206,863 186,638 Operating loss (28,398) (30,441) (140,983) (128,855) Interest expense 2,767 1,930 9,685 5,202 Loss on extinguishment of debt 4,663 — 4,663 1,027 Change in fair value of Additional Shares liability (243) — 727 — Change in fair value of Earn-Out liability (20,223) — (66,359) — Change in fair value of Public and Private Placement Warrants liability (1,917) — (5,900) — Other expense, net (781) (397) 3,862 760 Interest and other expense (income), net (15,734) 1,533 (53,322) 6,989 Loss before provision for income taxes (12,664) (31,974) (87,661) (135,844) Provision for income taxes 19 12 54 52 Net loss $ (12,683) $ (31,986) $ (87,715) $ (135,896)
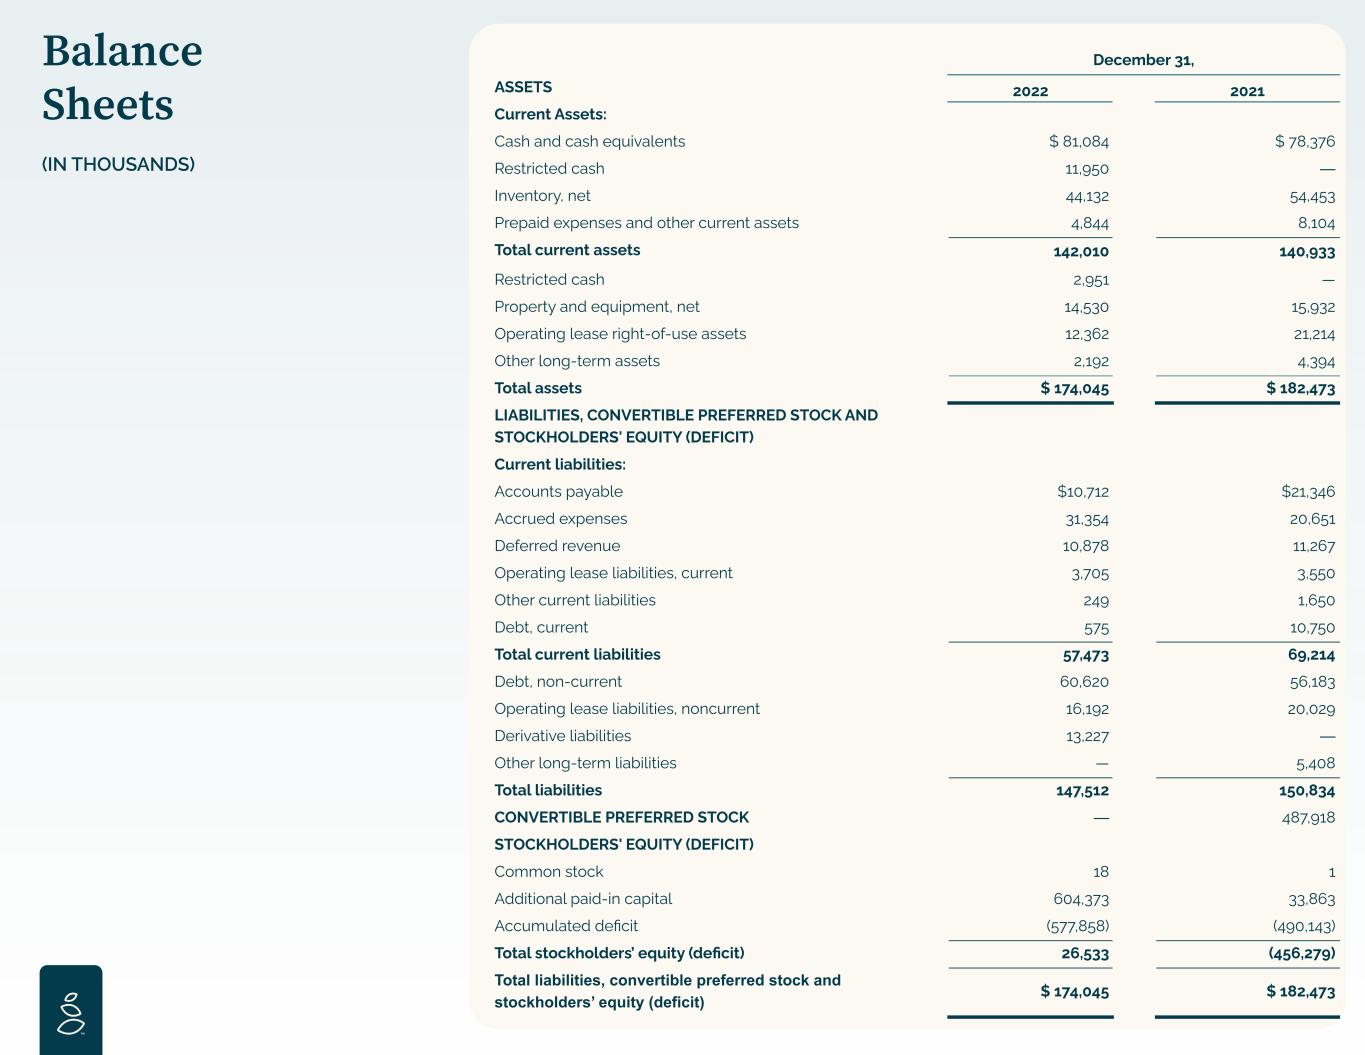
Balance Sheets (IN THOUSANDS) December 31, ASSETS 2022 2021 Current Assets: Cash and cash equivalents $ 81,084 $ 78,376 Restricted cash 11,950 — Inventory, net 44,132 54,453 Prepaid expenses and other current assets 4,844 8,104 Total current assets 142,010 140,933 Restricted cash 2,951 — Property and equipment, net 14,530 15,932 Operating lease right-of-use assets 12,362 21,214 Other long-term assets 2,192 4,394 Total assets $ 174,045 $ 182,473 LIABILITIES, CONVERTIBLE PREFERRED STOCK AND STOCKHOLDERS' EQUITY (DEFICIT) Current liabilities: Accounts payable $10,712 $21,346 Accrued expenses 31,354 20,651 Deferred revenue 10,878 11,267 Operating lease liabilities, current 3,705 3,550 Other current liabilities 249 1,650 Debt, current 575 10,750 Total current liabilities 57,473 69,214 Debt, non-current 60,620 56,183 Operating lease liabilities, noncurrent 16,192 20,029 Derivative liabilities 13,227 — Other long-term liabilities — 5,408 Total liabilities 147,512 150,834 CONVERTIBLE PREFERRED STOCK — 487,918 STOCKHOLDERS' EQUITY (DEFICIT) Common stock 18 1 Additional paid-in capital 604,373 33,863 Accumulated deficit (577,858) (490,143) Total stockholders’ equity (deficit) 26,533 (456,279) Total liabilities, convertible preferred stock and stockholders’ equity (deficit) $ 174,045 $ 182,473
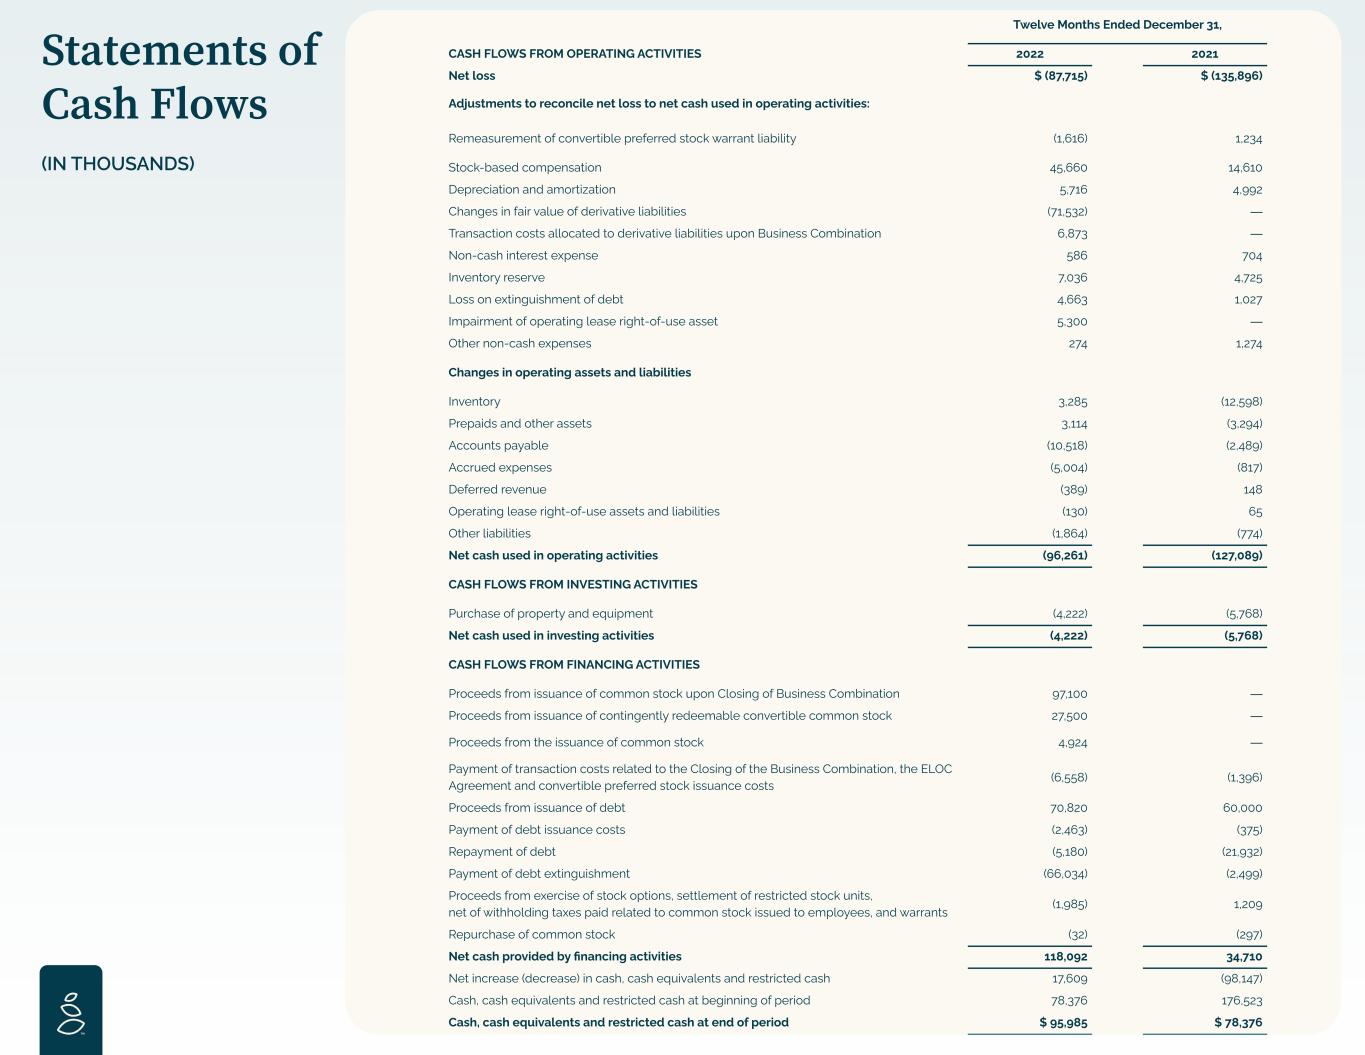
Statements of Cash Flows (IN THOUSANDS) Twelve Months Ended December 31, CASH FLOWS FROM OPERATING ACTIVITIES 2022 2021 Net loss $ (87,715) $ (135,896) Adjustments to reconcile net loss to net cash used in operating activities: Remeasurement of convertible preferred stock warrant liability (1,616) 1,234 Stock-based compensation 45,660 14,610 Depreciation and amortization 5,716 4,992 Changes in fair value of derivative liabilities (71,532) — Transaction costs allocated to derivative liabilities upon Business Combination 6,873 — Non-cash interest expense 586 704 Inventory reserve 7,036 4,725 Loss on extinguishment of debt 4,663 1,027 Impairment of operating lease right-of-use asset 5,300 — Other non-cash expenses 274 1,274 Changes in operating assets and liabilities Inventory 3,285 (12,598) Prepaids and other assets 3,114 (3,294) Accounts payable (10,518) (2,489) Accrued expenses (5,004) (817) Deferred revenue (389) 148 Operating lease right-of-use assets and liabilities (130) 65 Other liabilities (1,864) (774) Net cash used in operating activities (96,261) (127,089) CASH FLOWS FROM INVESTING ACTIVITIES Purchase of property and equipment (4,222) (5,768) Net cash used in investing activities (4,222) (5,768) CASH FLOWS FROM FINANCING ACTIVITIES Proceeds from issuance of common stock upon Closing of Business Combination 97,100 — Proceeds from issuance of contingently redeemable convertible common stock 27,500 — Proceeds from the issuance of common stock 4,924 — Payment of transaction costs related to the Closing of the Business Combination, the ELOC Agreement and convertible preferred stock issuance costs (6,558) (1,396) Proceeds from issuance of debt 70,820 60,000 Payment of debt issuance costs (2,463) (375) Repayment of debt (5,180) (21,932) Payment of debt extinguishment (66,034) (2,499) Proceeds from exercise of stock options, settlement of restricted stock units, net of withholding taxes paid related to common stock issued to employees, and warrants (1,985) 1,209 Repurchase of common stock (32) (297) Net cash provided by financing activities 118,092 34,710 Net increase (decrease) in cash, cash equivalents and restricted cash 17,609 (98,147) Cash, cash equivalents and restricted cash at beginning of period 78,376 176,523 Cash, cash equivalents and restricted cash at end of period $ 95,985 $ 78,376
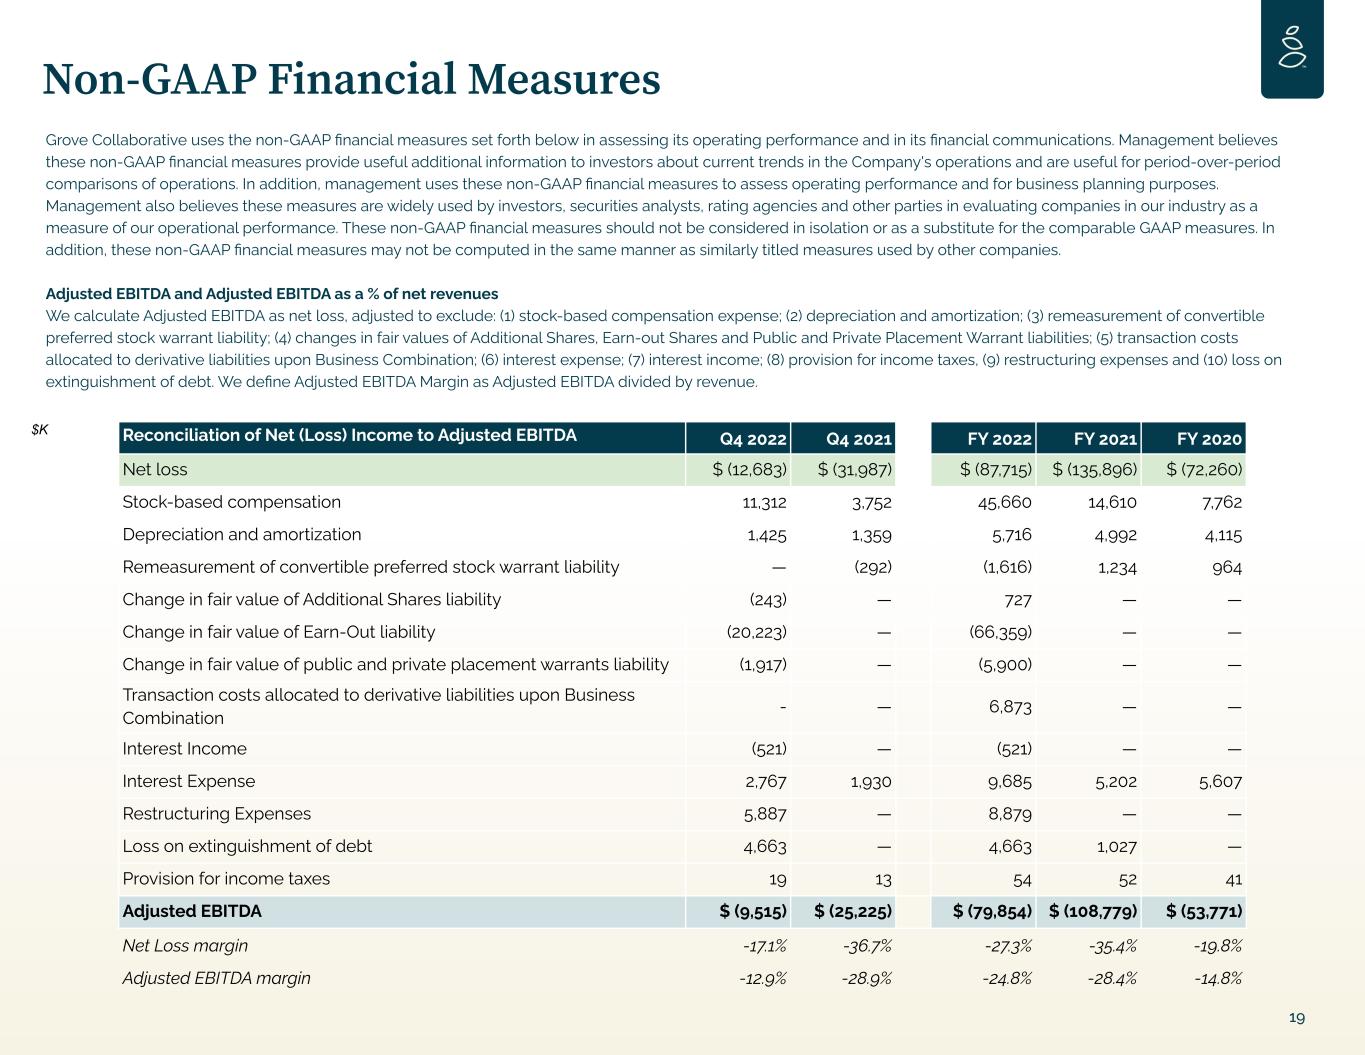
Non-GAAP Financial Measures 19 Grove Collaborative uses the non-GAAP financial measures set forth below in assessing its operating performance and in its financial communications. Management believes these non-GAAP financial measures provide useful additional information to investors about current trends in the Company's operations and are useful for period-over-period comparisons of operations. In addition, management uses these non-GAAP financial measures to assess operating performance and for business planning purposes. Management also believes these measures are widely used by investors, securities analysts, rating agencies and other parties in evaluating companies in our industry as a measure of our operational performance. These non-GAAP financial measures should not be considered in isolation or as a substitute for the comparable GAAP measures. In addition, these non-GAAP financial measures may not be computed in the same manner as similarly titled measures used by other companies. Adjusted EBITDA and Adjusted EBITDA as a % of net revenues We calculate Adjusted EBITDA as net loss, adjusted to exclude: (1) stock-based compensation expense; (2) depreciation and amortization; (3) remeasurement of convertible preferred stock warrant liability; (4) changes in fair values of Additional Shares, Earn-out Shares and Public and Private Placement Warrant liabilities; (5) transaction costs allocated to derivative liabilities upon Business Combination; (6) interest expense; (7) interest income; (8) provision for income taxes, (9) restructuring expenses and (10) loss on extinguishment of debt. We define Adjusted EBITDA Margin as Adjusted EBITDA divided by revenue. $K Reconciliation of Net (Loss) Income to Adjusted EBITDA Q4 2022 Q4 2021 FY 2022 FY 2021 FY 2020 Net loss $ (12,683) $ (31,987) $ (87,715) $ (135,896) $ (72,260) Stock-based compensation 11,312 3,752 45,660 14,610 7,762 Depreciation and amortization 1,425 1,359 5,716 4,992 4,115 Remeasurement of convertible preferred stock warrant liability — (292) (1,616) 1,234 964 Change in fair value of Additional Shares liability (243) — 727 — — Change in fair value of Earn-Out liability (20,223) — (66,359) — — Change in fair value of public and private placement warrants liability (1,917) — (5,900) — — Transaction costs allocated to derivative liabilities upon Business Combination - — 6,873 — — Interest Income (521) — (521) — — Interest Expense 2,767 1,930 9,685 5,202 5,607 Restructuring Expenses 5,887 — 8,879 — — Loss on extinguishment of debt 4,663 — 4,663 1,027 — Provision for income taxes 19 13 54 52 41 Adjusted EBITDA $ (9,515) $ (25,225) $ (79,854) $ (108,779) $ (53,771) Net Loss margin -17.1% -36.7% -27.3% -35.4% -19.8% Adjusted EBITDA margin -12.9% -28.9% -24.8% -28.4% -14.8%

Thank you