Q2 2022 Earnings Presentation
2 Forward-Looking Statements / Non-GAAP Financial Measures Forward-Looking Statements This presentation contains forward-looking statements within the “safe harbor” provisions of the Private Securities Litigation Reform Act of 1995. All statements other than those that are purely historical are forward-looking statements. Forward-looking statements include statements identified as such in our August 11, 2022 press release. Because these forward-looking statements involve risks and uncertainties, there are important factors that could cause our actual results to differ materially from those in the forward-looking statements. Additional information regarding factors that could cause results to differ can be found in the Company’s Quarterly Report on Form 10-Q for the quarter ended June 30, 2022, as well as the Company’s subsequent filings with the Securities and Exchange Commission. These forward-looking statements are based on information as of August 11, 2022. We assume no obligation to publicly update or revise our forward-looking statements even if experience or future changes make it clear that any projected results expressed or implied therein will not be realized. SEC Regulation G This presentation includes the non-GAAP measure Adjusted EBITDA. The description and reconciliation of this measure from GAAP is included in our August 11, 2022 earnings press release, which is available on investors.grove.co.
Q2 2022 Business Highlights 3
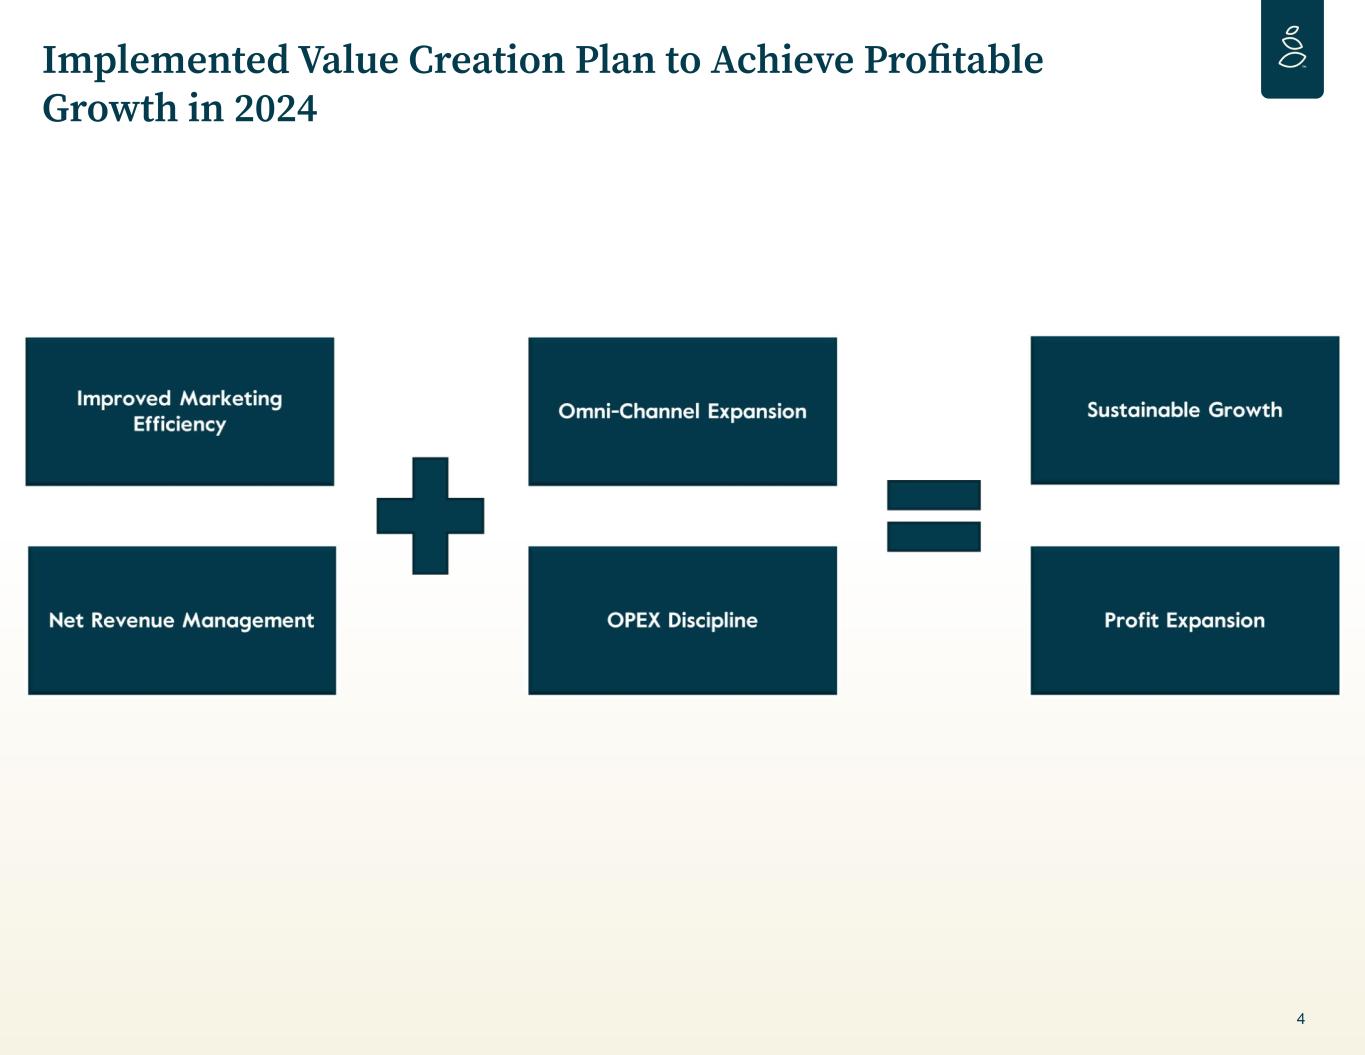
Implemented Value Creation Plan to Achieve Profitable Growth in 2024 4
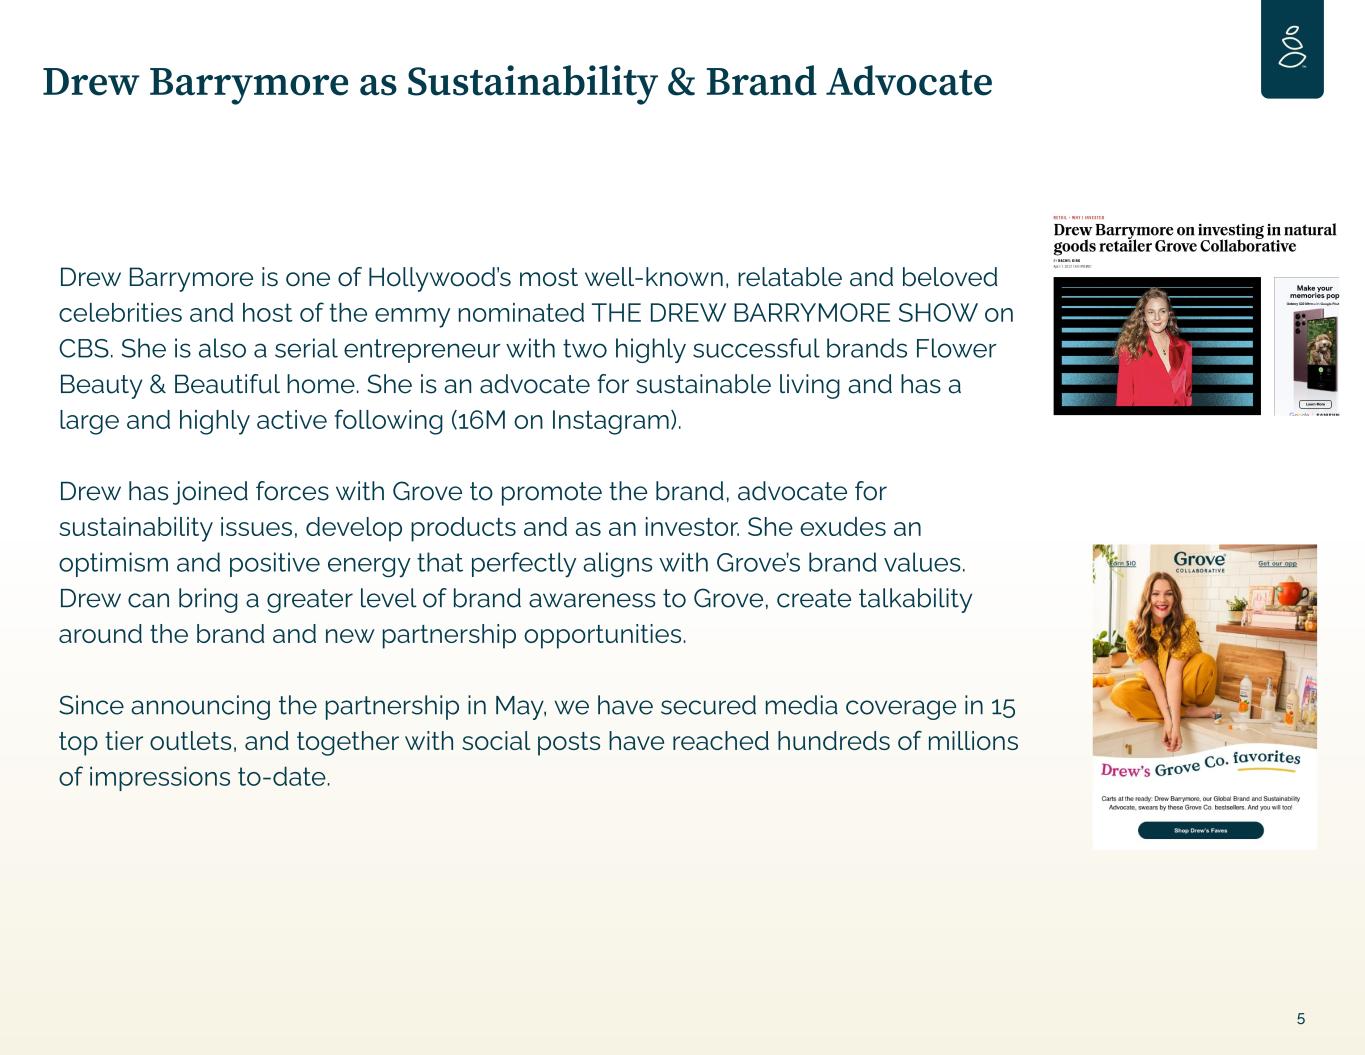
Drew Barrymore as Sustainability & Brand Advocate Drew Barrymore is one of Hollywood’s most well-known, relatable and beloved celebrities and host of the emmy nominated THE DREW BARRYMORE SHOW on CBS. She is also a serial entrepreneur with two highly successful brands Flower Beauty & Beautiful home. She is an advocate for sustainable living and has a large and highly active following (16M on Instagram). Drew has joined forces with Grove to promote the brand, advocate for sustainability issues, develop products and as an investor. She exudes an optimism and positive energy that perfectly aligns with Grove’s brand values. Drew can bring a greater level of brand awareness to Grove, create talkability around the brand and new partnership opportunities. Since announcing the partnership in May, we have secured media coverage in 15 top tier outlets, and together with social posts have reached hundreds of millions of impressions to-date. 5
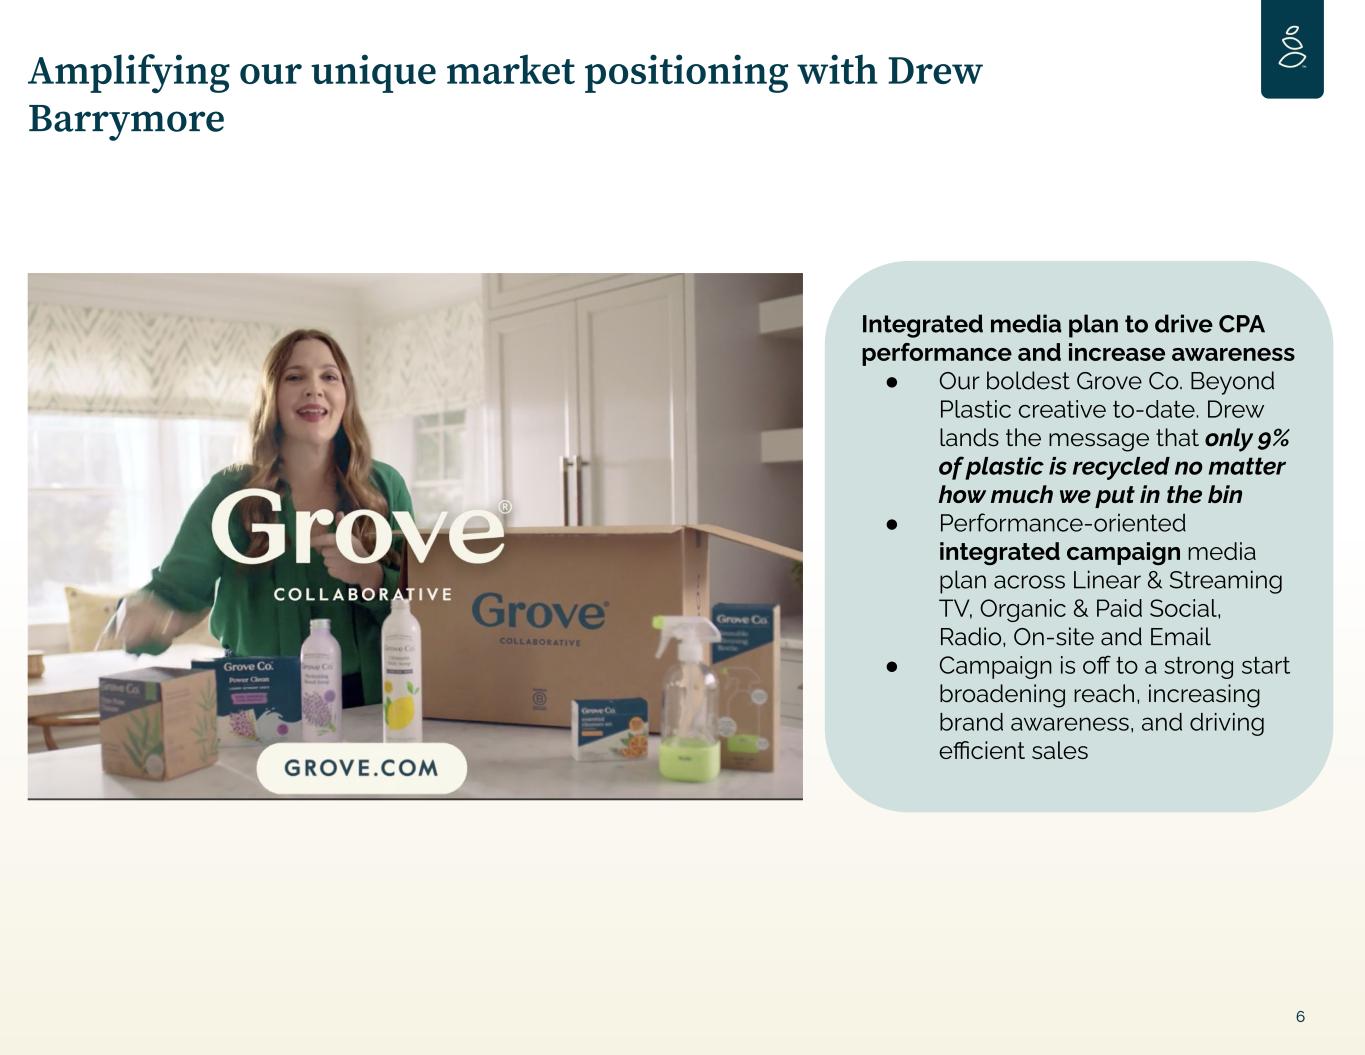
Amplifying our unique market positioning with Drew Barrymore 6 Drew Barrymore 30s Ad Link Integrated media plan to drive CPA performance and increase awareness ● Our boldest Grove Co. Beyond Plastic creative to-date. Drew lands the message that only 9% of plastic is recycled no matter how much we put in the bin ● Performance-oriented integrated campaign media plan across Linear & Streaming TV, Organic & Paid Social, Radio, On-site and Email ● Campaign is off to a strong start broadening reach, increasing brand awareness, and driving efficient sales
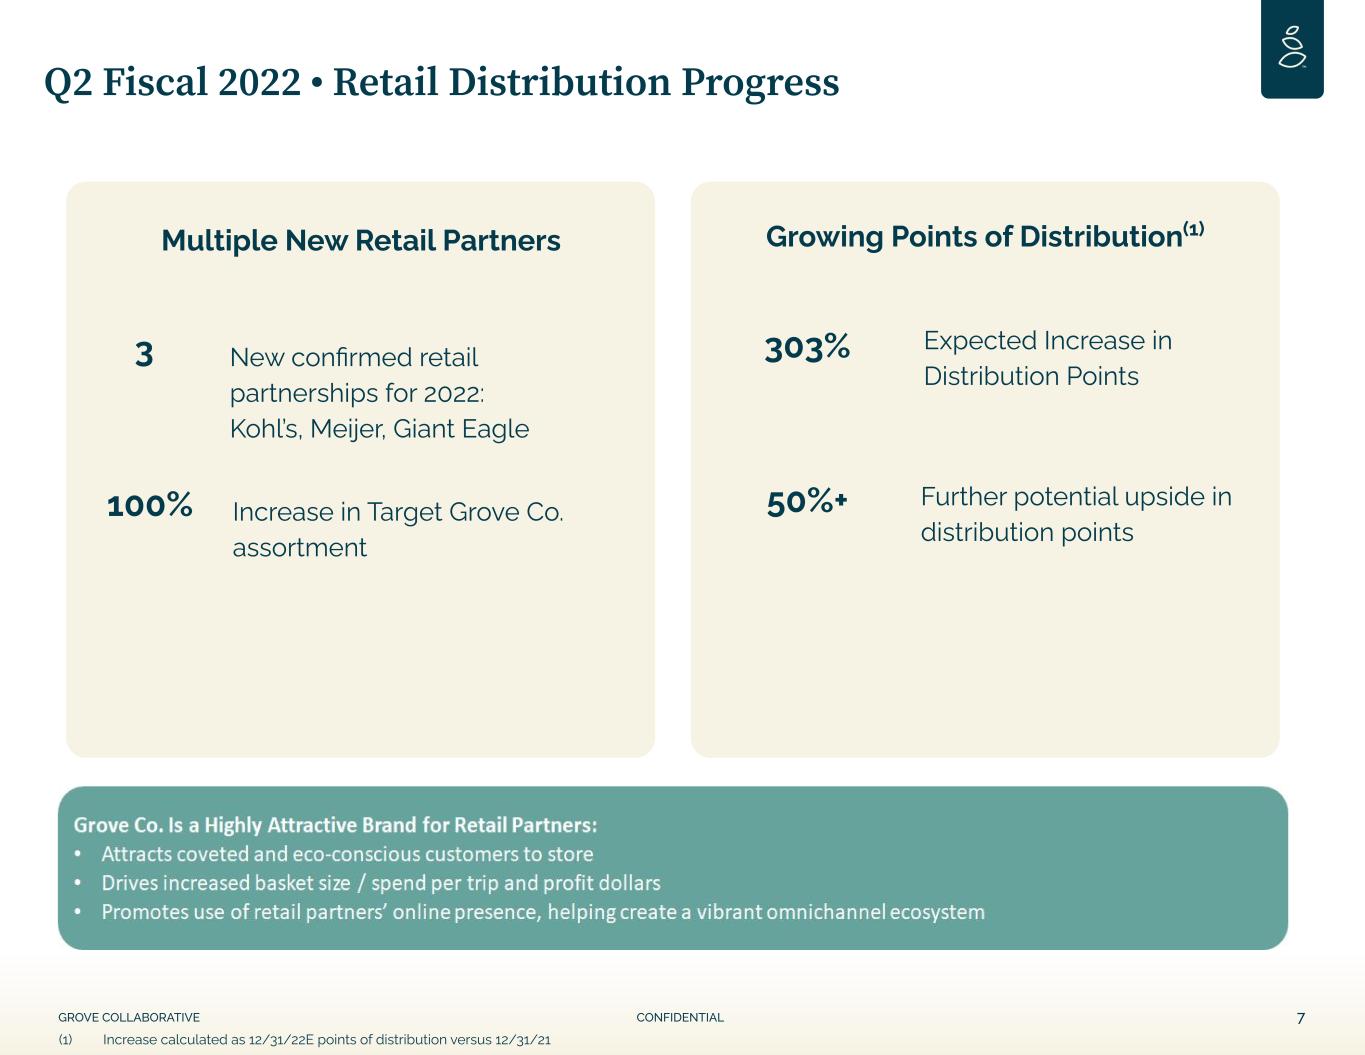
GROVE COLLABORATIVE CONFIDENTIAL 7 Q2 Fiscal 2022 • Retail Distribution Progress Increase in Target Grove Co. assortment New confirmed retail partnerships for 2022: Kohl’s, Meijer, Giant Eagle 100% 3 Multiple New Retail Partners Further potential upside in distribution points Expected Increase in Distribution Points 50%+ 303% Growing Points of Distribution(1) (1) Increase calculated as 12/31/22E points of distribution versus 12/31/21
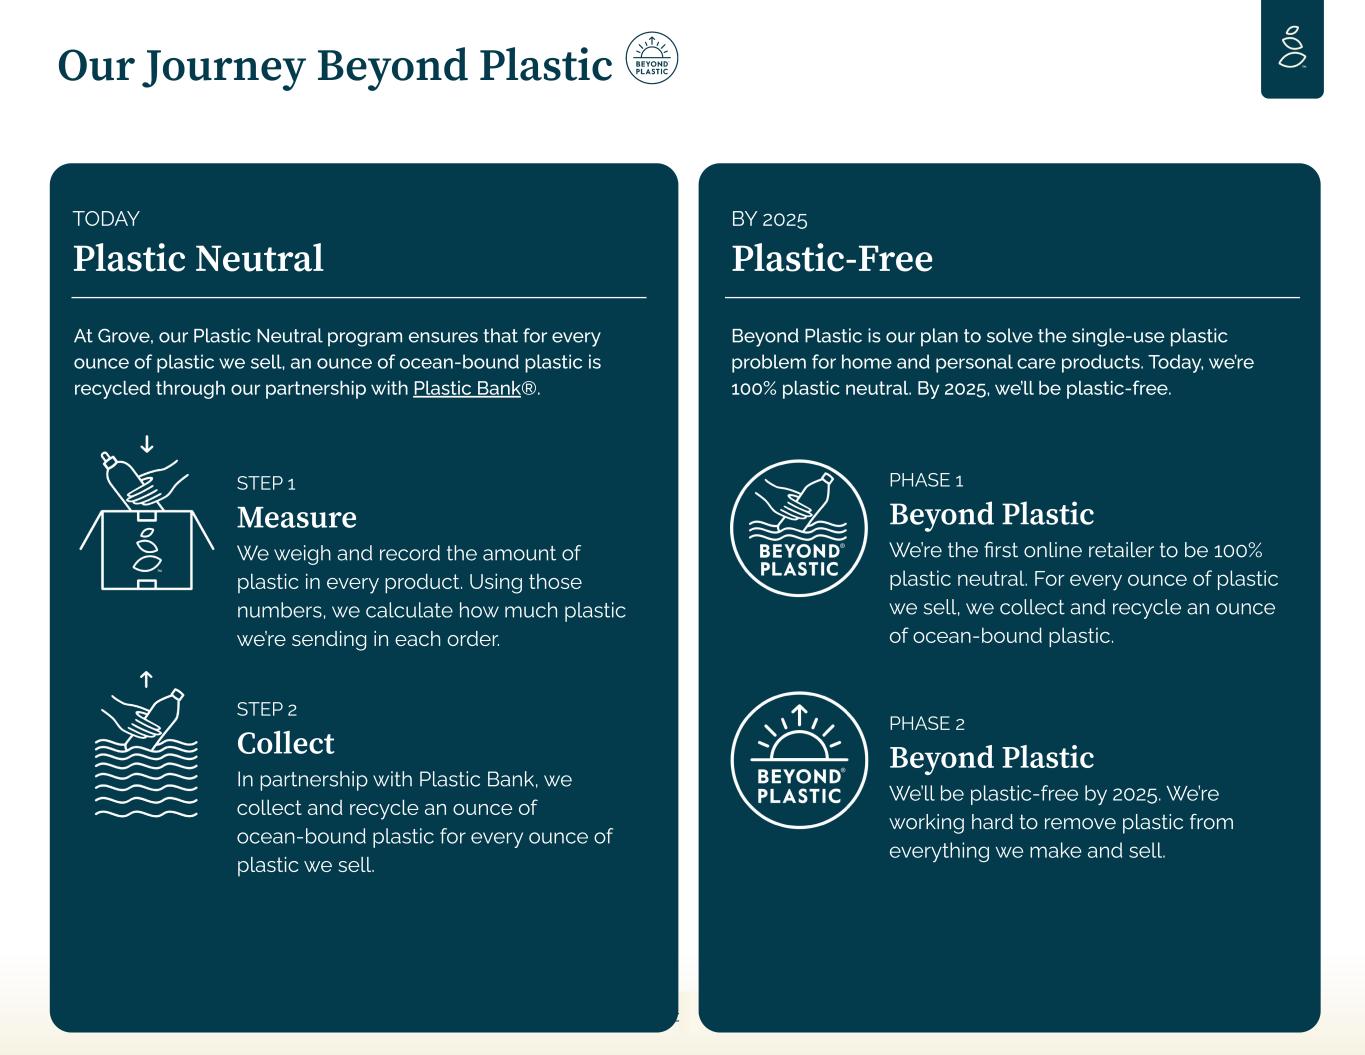
GROVE COLLABORATIVE CONFIDENTIAL Our Journey Beyond Plastic TODAY Plastic Neutral At Grove, our Plastic Neutral program ensures that for every ounce of plastic we sell, an ounce of ocean-bound plastic is recycled through our partnership with Plastic Bank®. STEP 1 Measure We weigh and record the amount of plastic in every product. Using those numbers, we calculate how much plastic we’re sending in each order. STEP 2 Collect In partnership with Plastic Bank, we collect and recycle an ounce of ocean-bound plastic for every ounce of plastic we sell. BY 2025 Plastic-Free Beyond Plastic is our plan to solve the single-use plastic problem for home and personal care products. Today, we’re 100% plastic neutral. By 2025, we’ll be plastic-free. PHASE 1 Beyond Plastic We’re the first online retailer to be 100% plastic neutral. For every ounce of plastic we sell, we collect and recycle an ounce of ocean-bound plastic. PHASE 2 Beyond Plastic We’ll be plastic-free by 2025. We’re working hard to remove plastic from everything we make and sell. 8
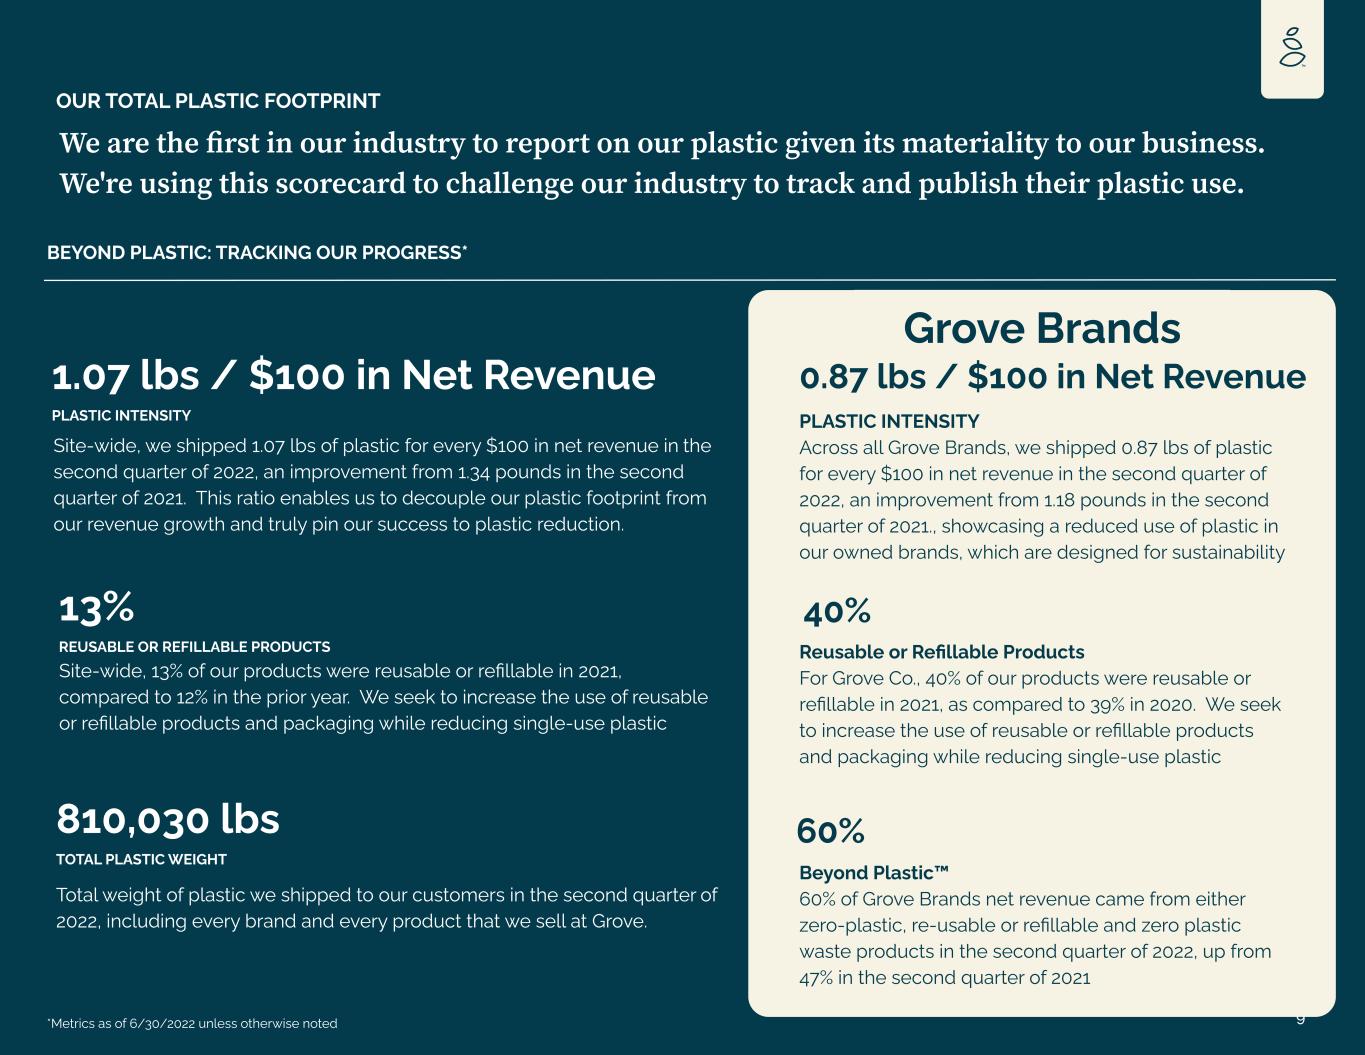
99 OUR TOTAL PLASTIC FOOTPRINT BEYOND PLASTIC: TRACKING OUR PROGRESS* We are the first in our industry to report on our plastic given its materiality to our business. We're using this scorecard to challenge our industry to track and publish their plastic use. 810,030 lbs TOTAL PLASTIC WEIGHT Total weight of plastic we shipped to our customers in the second quarter of 2022, including every brand and every product that we sell at Grove. *Metrics as of 6/30/2022 unless otherwise noted Beyond Plastic™ 60% of Grove Brands net revenue came from either zero-plastic, re-usable or refillable and zero plastic waste products in the second quarter of 2022, up from 47% in the second quarter of 2021 60% Grove Brands Site-wide, we shipped 1.07 lbs of plastic for every $100 in net revenue in the second quarter of 2022, an improvement from 1.34 pounds in the second quarter of 2021. This ratio enables us to decouple our plastic footprint from our revenue growth and truly pin our success to plastic reduction. 1.07 lbs / $100 in Net Revenue PLASTIC INTENSITY PLASTIC INTENSITY Across all Grove Brands, we shipped 0.87 lbs of plastic for every $100 in net revenue in the second quarter of 2022, an improvement from 1.18 pounds in the second quarter of 2021., showcasing a reduced use of plastic in our owned brands, which are designed for sustainability 0.87 lbs / $100 in Net Revenue Site-wide, 13% of our products were reusable or refillable in 2021, compared to 12% in the prior year. We seek to increase the use of reusable or refillable products and packaging while reducing single-use plastic 13% REUSABLE OR REFILLABLE PRODUCTS Reusable or Refillable Products For Grove Co., 40% of our products were reusable or refillable in 2021, as compared to 39% in 2020. We seek to increase the use of reusable or refillable products and packaging while reducing single-use plastic 40%
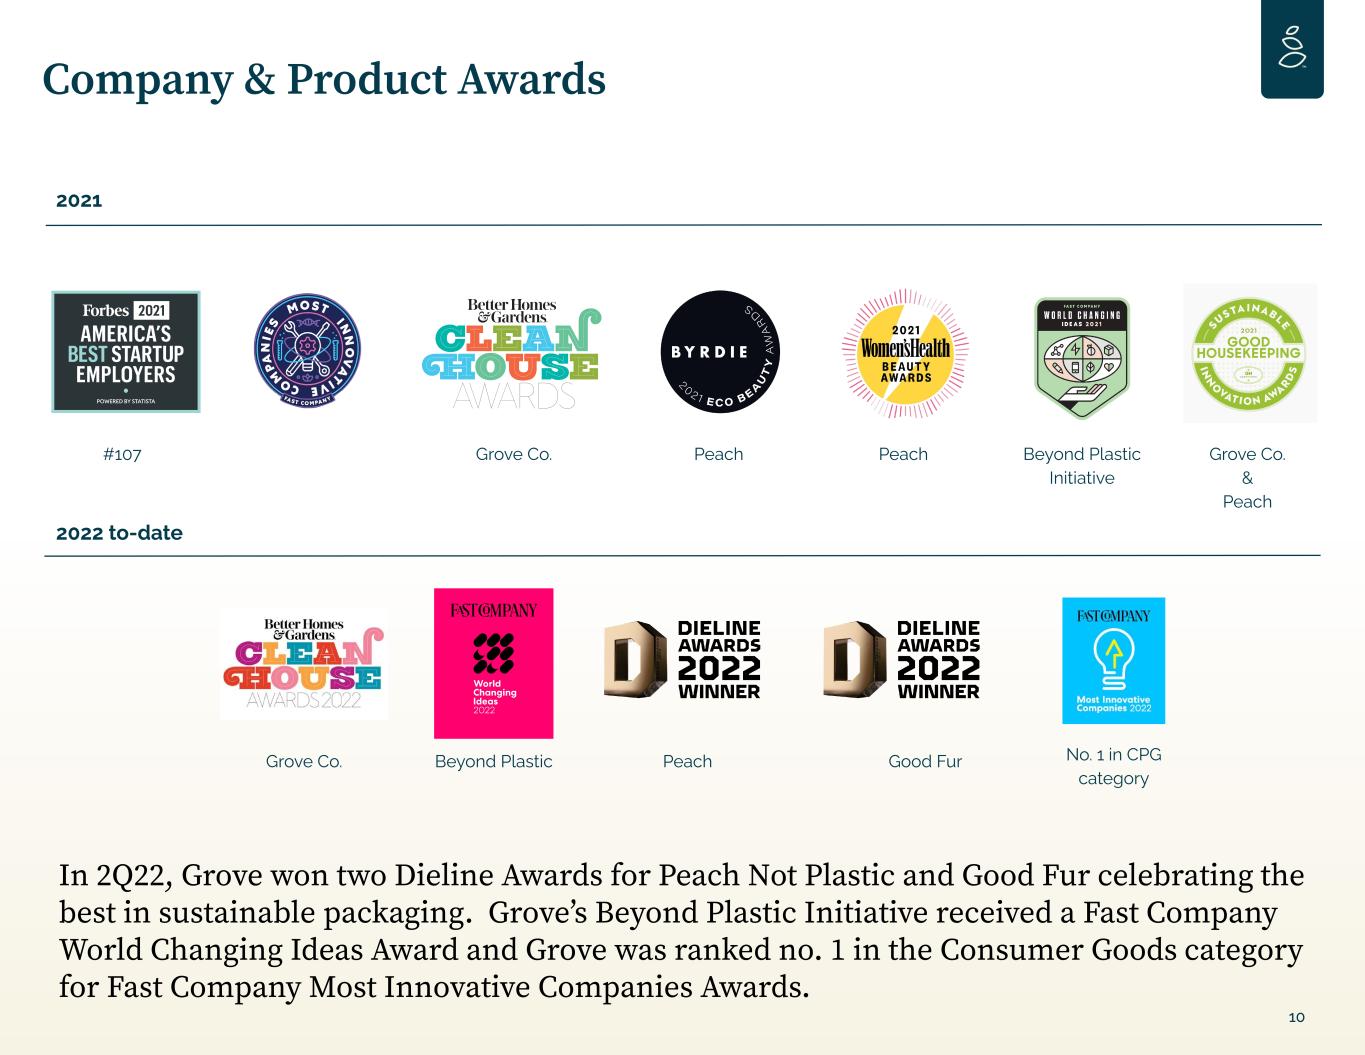
2022 to-date #107 Grove Co. Peach Peach Beyond Plastic Initiative 10 Company & Product Awards Grove Co. & Peach In 2Q22, Grove won two Dieline Awards for Peach Not Plastic and Good Fur celebrating the best in sustainable packaging. Grove s̓ Beyond Plastic Initiative received a Fast Company World Changing Ideas Award and Grove was ranked no. 1 in the Consumer Goods category for Fast Company Most Innovative Companies Awards. 2021 Grove Co. Beyond Plastic Peach Good Fur No. 1 in CPG category
Q2 2022 Financial Update 11
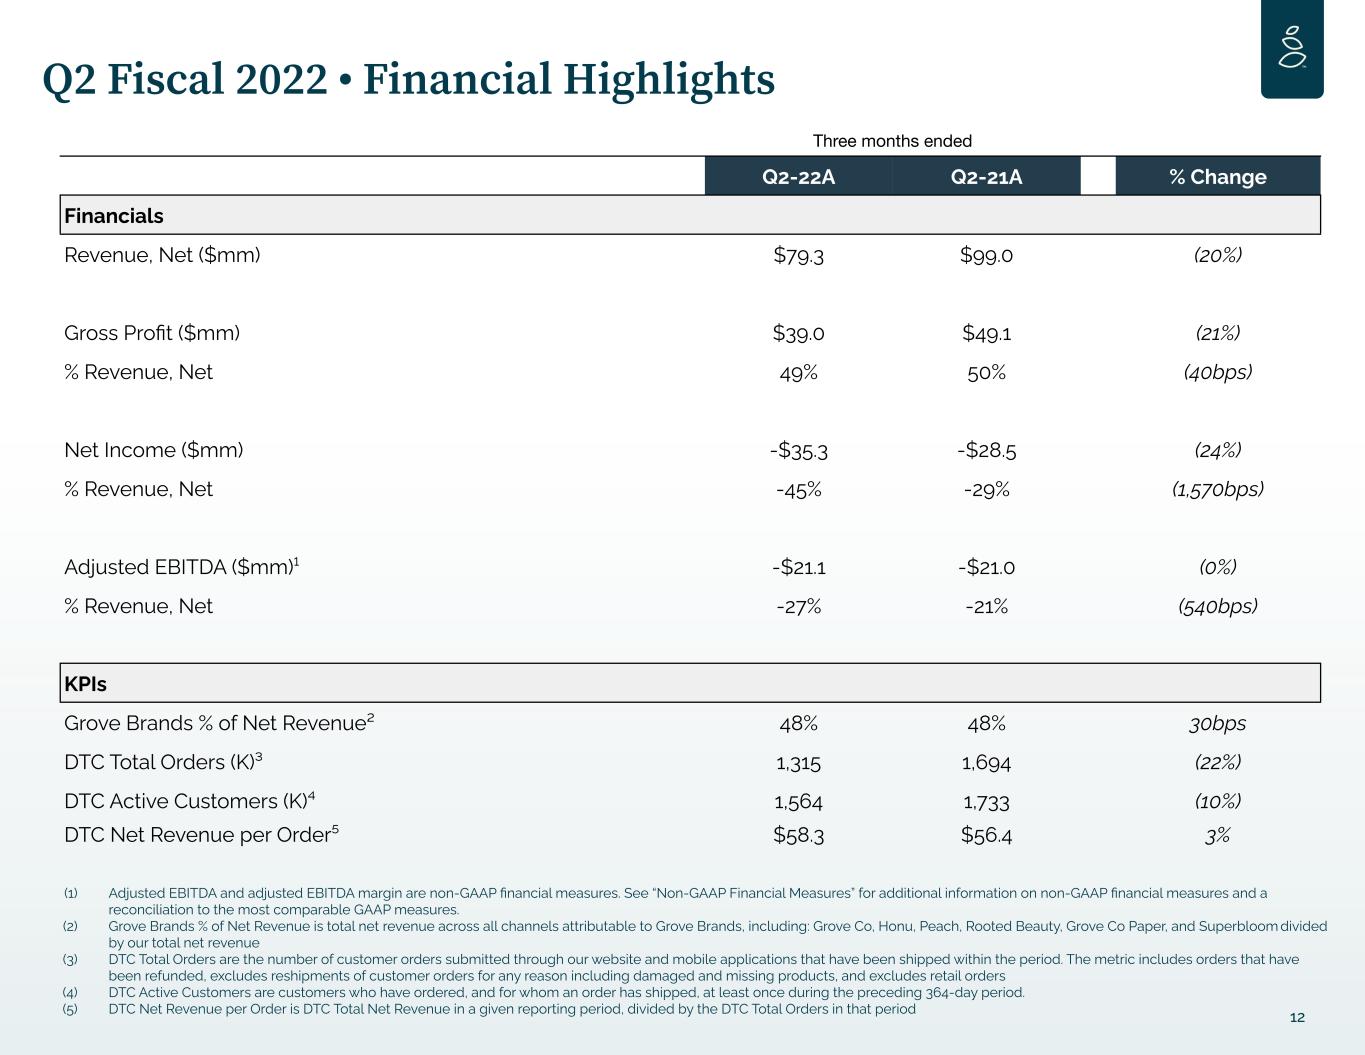
12 Q2 Fiscal 2022 • Financial Highlights (1) Adjusted EBITDA and adjusted EBITDA margin are non-GAAP financial measures. See “Non-GAAP Financial Measures” for additional information on non-GAAP financial measures and a reconciliation to the most comparable GAAP measures. (2) Grove Brands % of Net Revenue is total net revenue across all channels attributable to Grove Brands, including: Grove Co, Honu, Peach, Rooted Beauty, Grove Co Paper, and Superbloom divided by our total net revenue (3) DTC Total Orders are the number of customer orders submitted through our website and mobile applications that have been shipped within the period. The metric includes orders that have been refunded, excludes reshipments of customer orders for any reason including damaged and missing products, and excludes retail orders (4) DTC Active Customers are customers who have ordered, and for whom an order has shipped, at least once during the preceding 364-day period. (5) DTC Net Revenue per Order is DTC Total Net Revenue in a given reporting period, divided by the DTC Total Orders in that period Three months ended Q2-22A Q2-21A % Change Financials Revenue, Net ($mm) $79.3 $99.0 (20%) Gross Profit ($mm) $39.0 $49.1 (21%) % Revenue, Net 49% 50% (40bps) Net Income ($mm) -$35.3 -$28.5 (24%) % Revenue, Net -45% -29% (1,570bps) Adjusted EBITDA ($mm)¹ -$21.1 -$21.0 (0%) % Revenue, Net -27% -21% (540bps) KPIs Grove Brands % of Net Revenue² 48% 48% 30bps DTC Total Orders (K)³ 1,315 1,694 (22%) DTC Active Customers (K)⁴ 1,564 1,733 (10%) DTC Net Revenue per Order⁵ $58.3 $56.4 3%
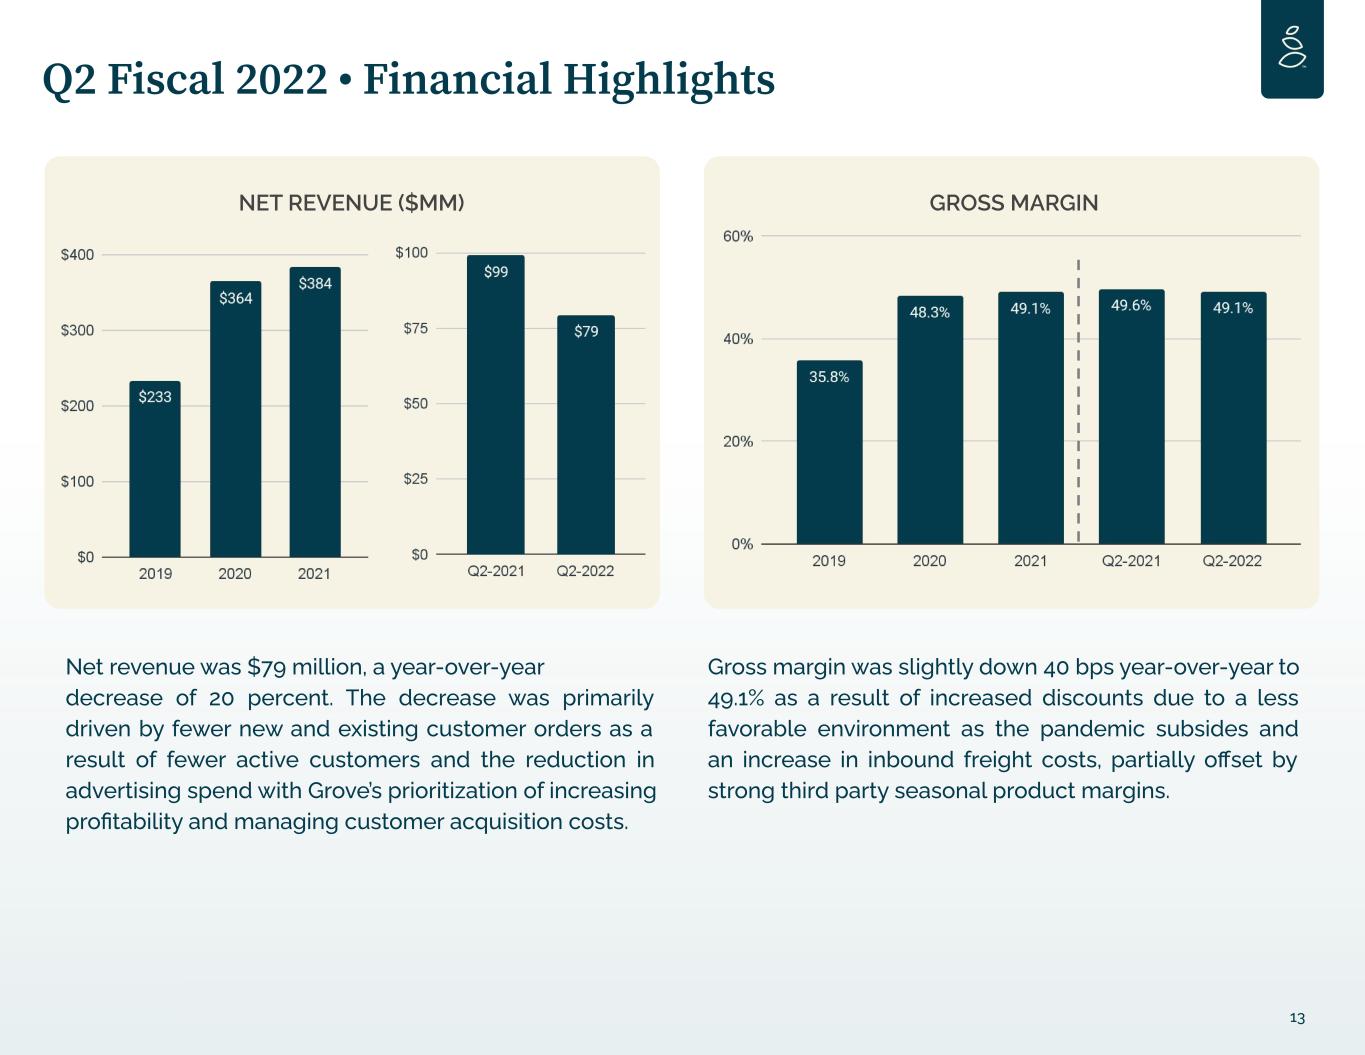
13 Q2 Fiscal 2022 • Financial Highlights Net revenue was $79 million, a year-over-year decrease of 20 percent. The decrease was primarily driven by fewer new and existing customer orders as a result of fewer active customers and the reduction in advertising spend with Grove’s prioritization of increasing profitability and managing customer acquisition costs. Gross margin was slightly down 40 bps year-over-year to 49.1% as a result of increased discounts due to a less favorable environment as the pandemic subsides and an increase in inbound freight costs, partially offset by strong third party seasonal product margins. GROSS MARGIN NET REVENUE ($MM)
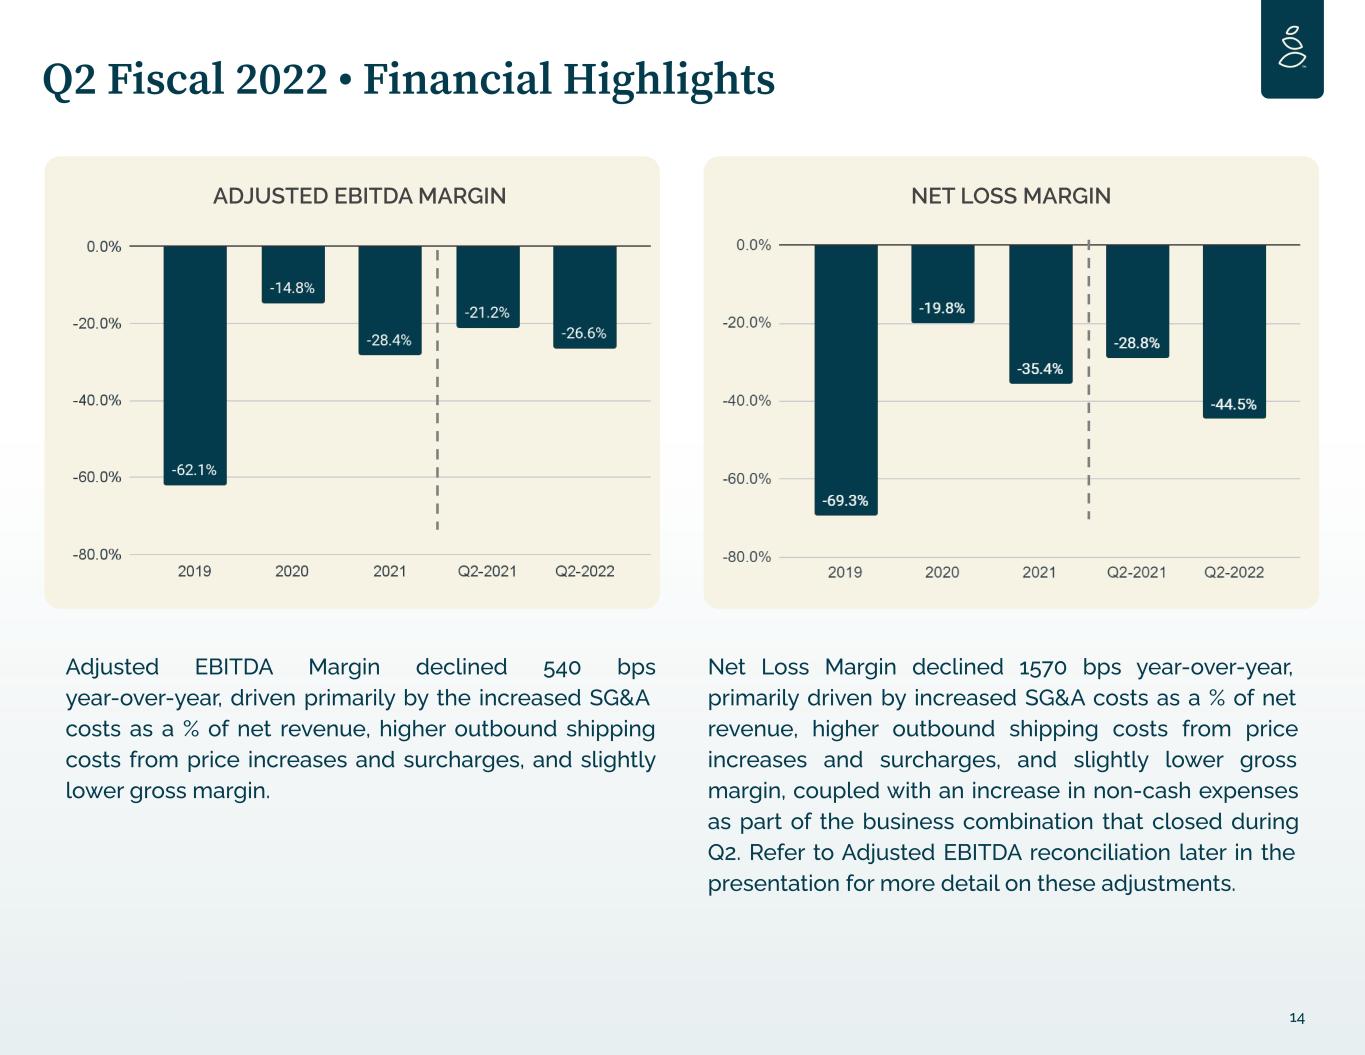
Adjusted EBITDA Margin declined 540 bps year-over-year, driven primarily by the increased SG&A costs as a % of net revenue, higher outbound shipping costs from price increases and surcharges, and slightly lower gross margin. 14 Q2 Fiscal 2022 • Financial Highlights ADJUSTED EBITDA MARGIN Net Loss Margin declined 1570 bps year-over-year, primarily driven by increased SG&A costs as a % of net revenue, higher outbound shipping costs from price increases and surcharges, and slightly lower gross margin, coupled with an increase in non-cash expenses as part of the business combination that closed during Q2. Refer to Adjusted EBITDA reconciliation later in the presentation for more detail on these adjustments. NET LOSS MARGIN
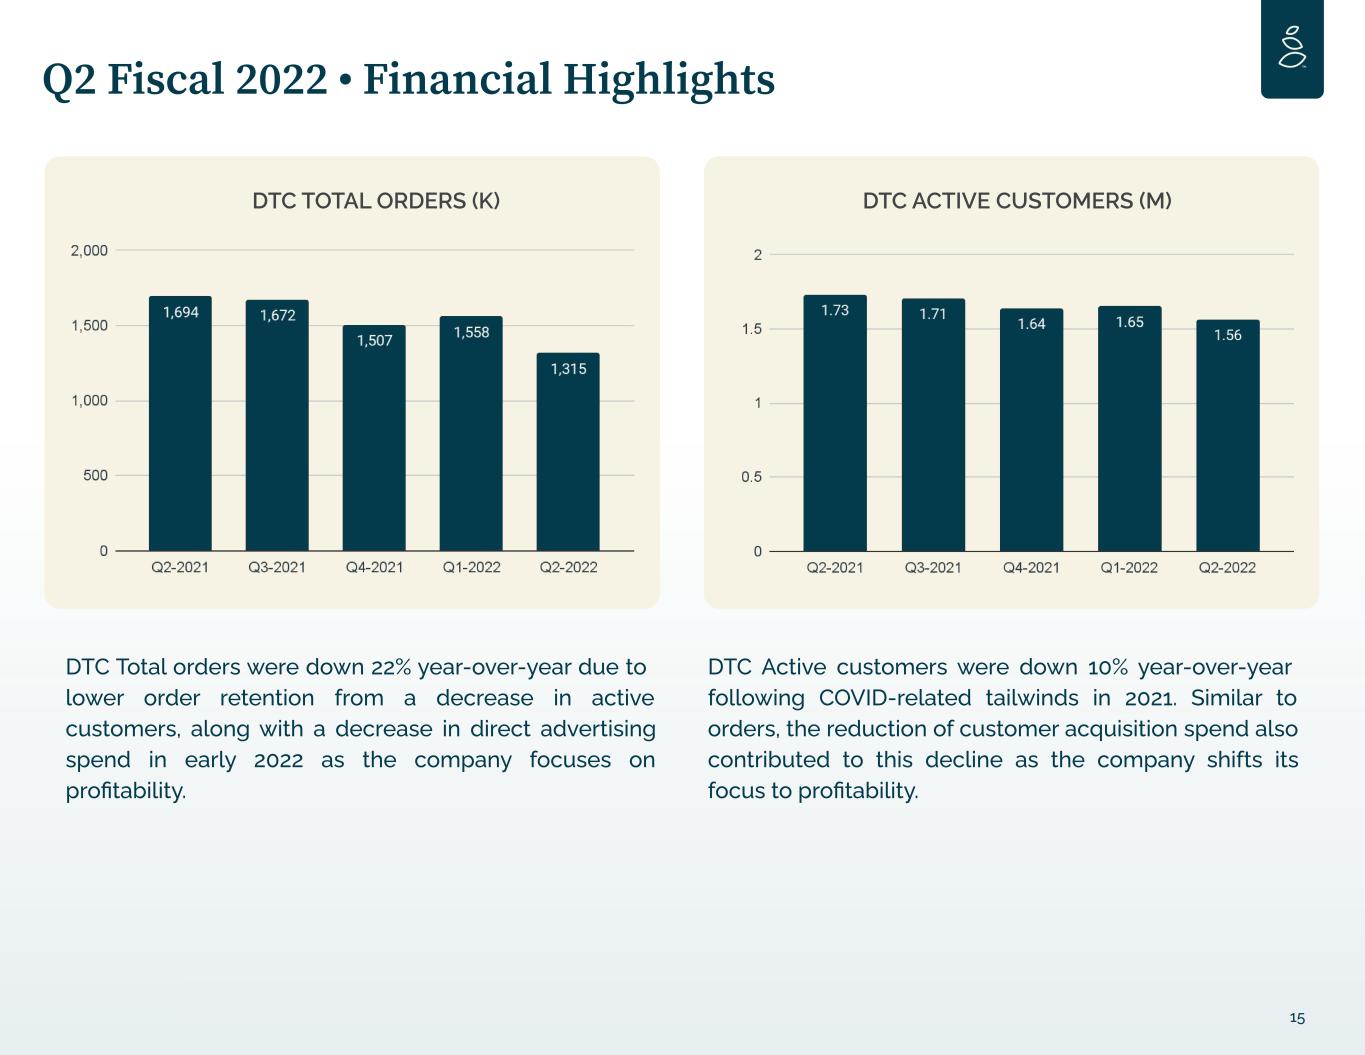
15 Q2 Fiscal 2022 • Financial Highlights DTC Total orders were down 22% year-over-year due to lower order retention from a decrease in active customers, along with a decrease in direct advertising spend in early 2022 as the company focuses on profitability. DTC Active customers were down 10% year-over-year following COVID-related tailwinds in 2021. Similar to orders, the reduction of customer acquisition spend also contributed to this decline as the company shifts its focus to profitability. DTC ACTIVE CUSTOMERS (M)DTC TOTAL ORDERS (K)
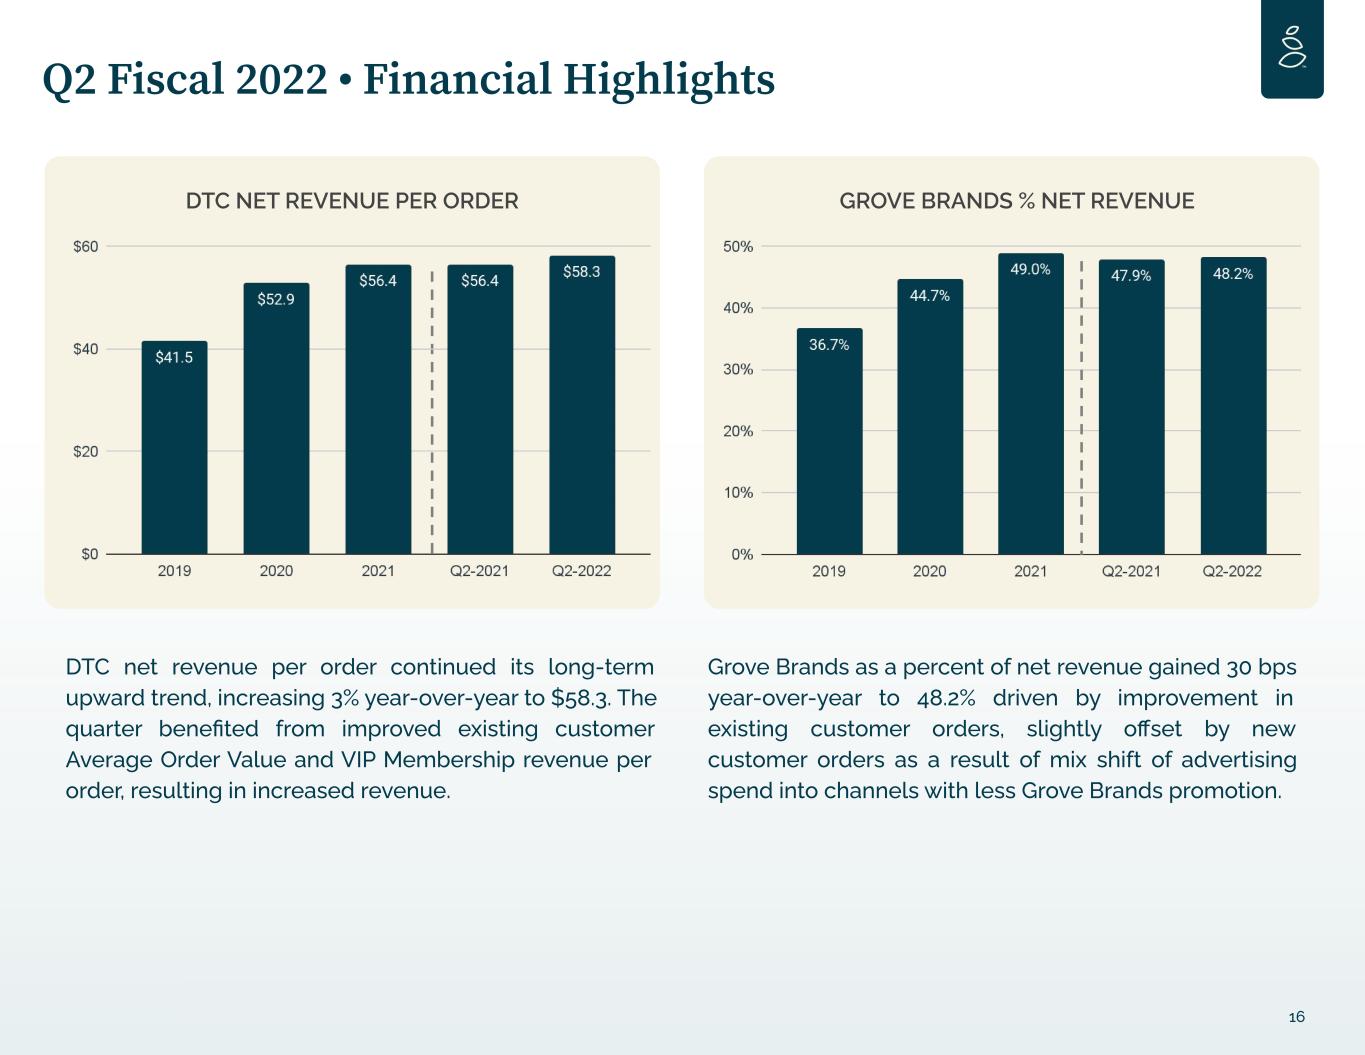
Grove Brands as a percent of net revenue gained 30 bps year-over-year to 48.2% driven by improvement in existing customer orders, slightly offset by new customer orders as a result of mix shift of advertising spend into channels with less Grove Brands promotion. DTC net revenue per order continued its long-term upward trend, increasing 3% year-over-year to $58.3. The quarter benefited from improved existing customer Average Order Value and VIP Membership revenue per order, resulting in increased revenue. 16 Q2 Fiscal 2022 • Financial Highlights DTC NET REVENUE PER ORDER GROVE BRANDS % NET REVENUE
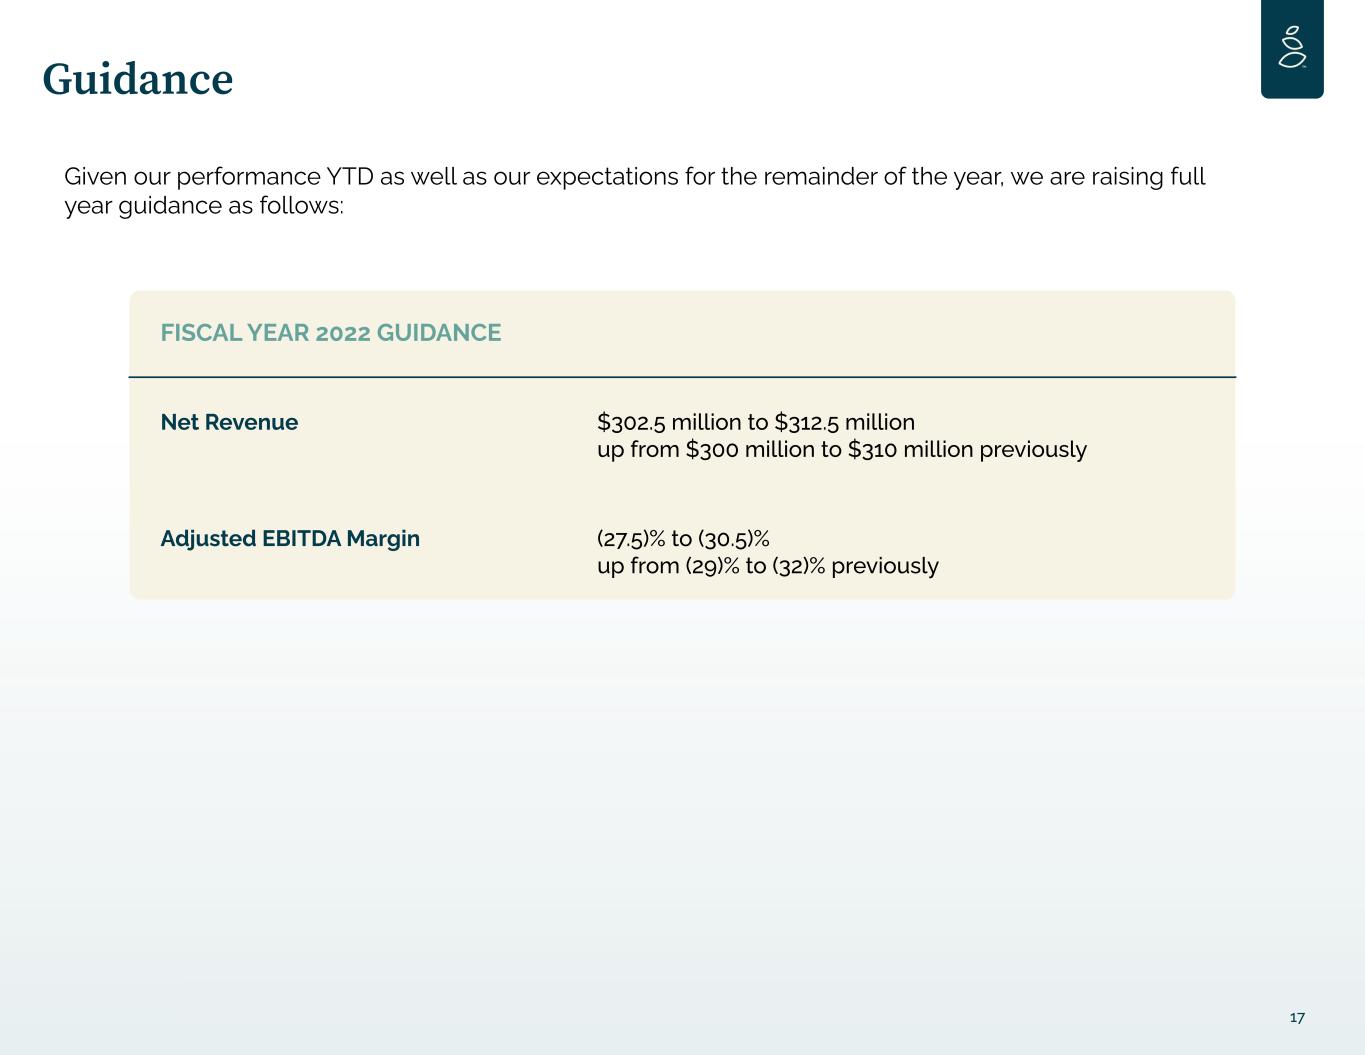
FISCAL YEAR 2022 GUIDANCE Net Revenue $302.5 million to $312.5 million up from $300 million to $310 million previously Adjusted EBITDA Margin (27.5)% to (30.5)% up from (29)% to (32)% previously 17 Guidance Given our performance YTD as well as our expectations for the remainder of the year, we are raising full year guidance as follows:

Financial Statements 18
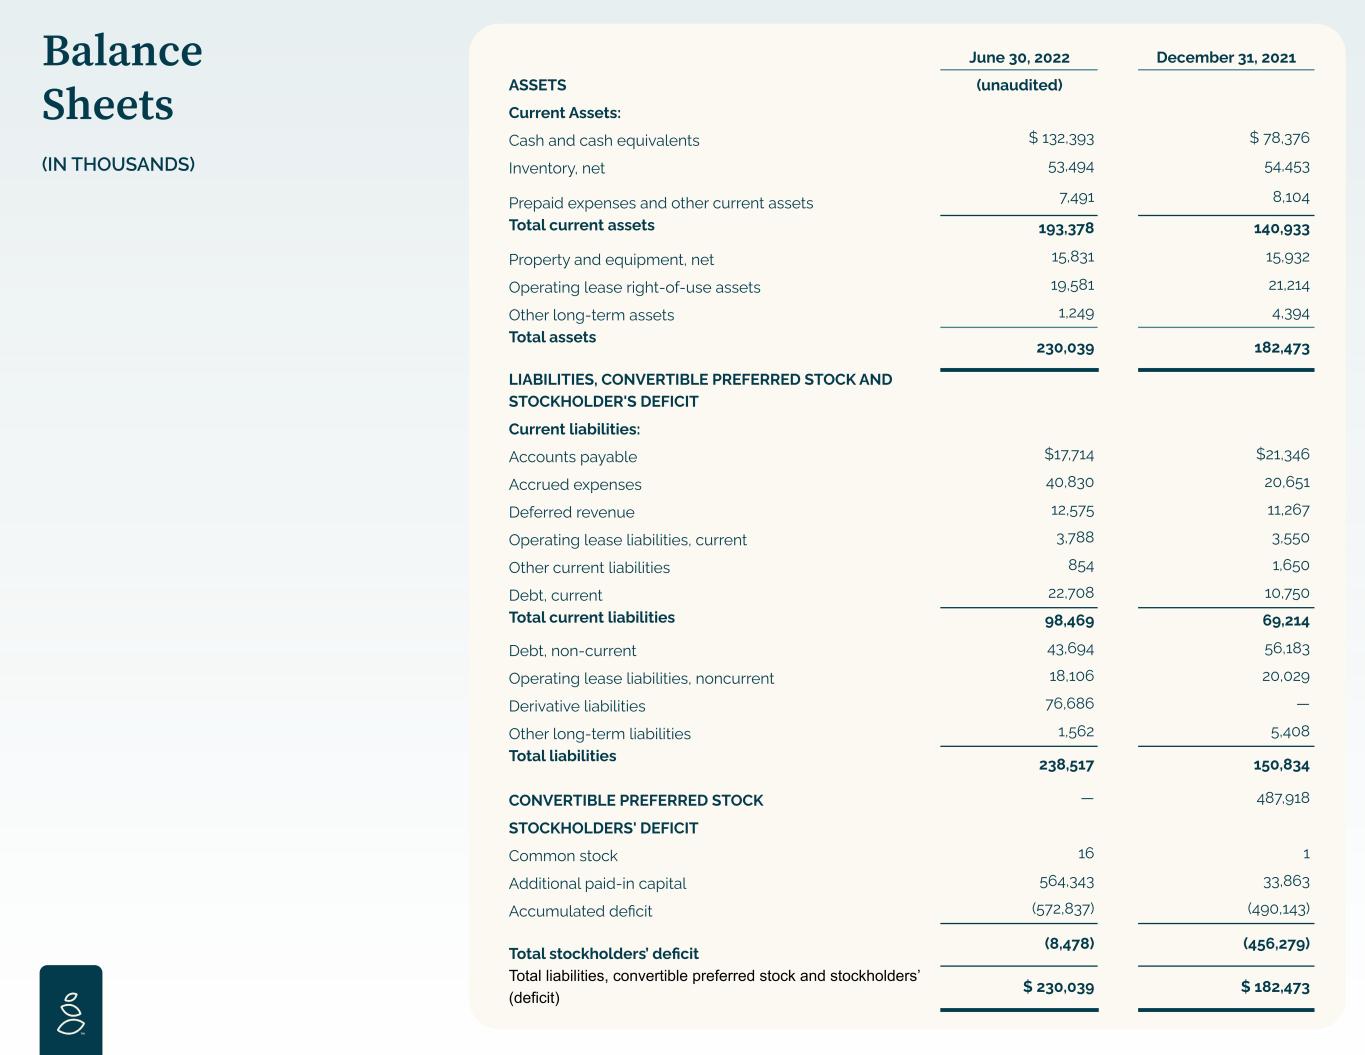
Balance Sheets (IN THOUSANDS) June 30, 2022 December 31, 2021 ASSETS (unaudited) Current Assets: Cash and cash equivalents $ 132,393 $ 78,376 Inventory, net 53,494 54,453 Prepaid expenses and other current assets 7,491 8,104 Total current assets 193,378 140,933 Property and equipment, net 15,831 15,932 Operating lease right-of-use assets 19,581 21,214 Other long-term assets 1,249 4,394 Total assets 230,039 182,473 LIABILITIES, CONVERTIBLE PREFERRED STOCK AND STOCKHOLDER'S DEFICIT Current liabilities: Accounts payable $17,714 $21,346 Accrued expenses 40,830 20,651 Deferred revenue 12,575 11,267 Operating lease liabilities, current 3,788 3,550 Other current liabilities 854 1,650 Debt, current 22,708 10,750 Total current liabilities 98,469 69,214 Debt, non-current 43,694 56,183 Operating lease liabilities, noncurrent 18,106 20,029 Derivative liabilities 76,686 — Other long-term liabilities 1,562 5,408 Total liabilities 238,517 150,834 CONVERTIBLE PREFERRED STOCK — 487,918 STOCKHOLDERS' DEFICIT Common stock 16 1 Additional paid-in capital 564,343 33,863 Accumulated deficit (572,837) (490,143) Total stockholders’ deficit (8,478) (456,279) Total liabilities, convertible preferred stock and stockholders’ (deficit) $ 230,039 $ 182,473
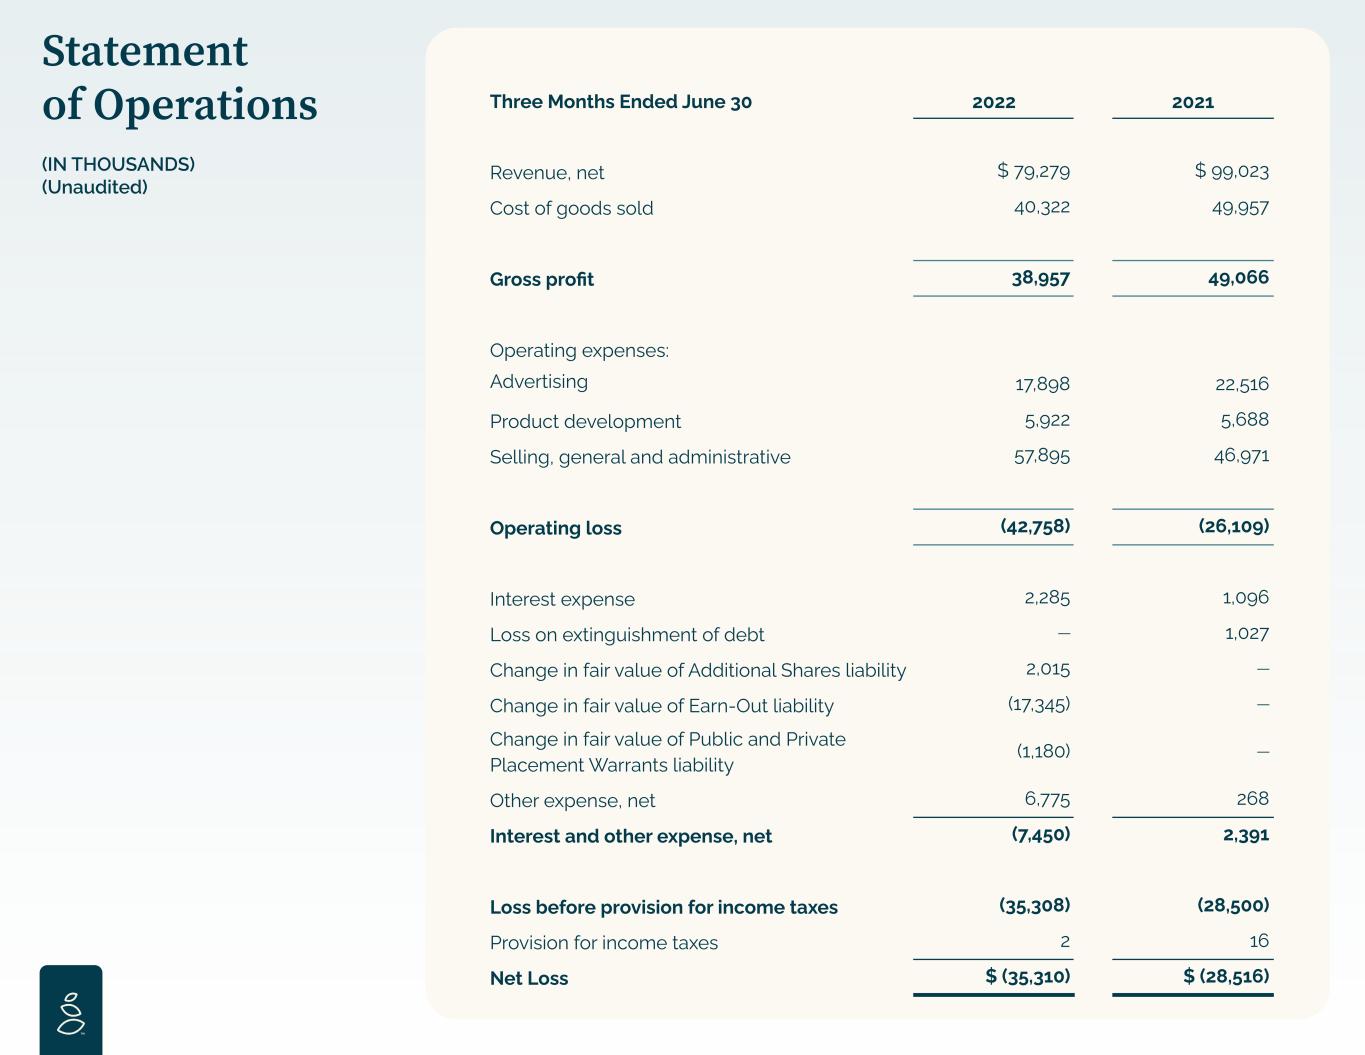
Statement of Operations (IN THOUSANDS) (Unaudited) Three Months Ended June 30 2022 2021 Revenue, net $ 79,279 $ 99,023 Cost of goods sold 40,322 49,957 Gross profit 38,957 49,066 Operating expenses: Advertising 17,898 22,516 Product development 5,922 5,688 Selling, general and administrative 57,895 46,971 Operating loss (42,758) (26,109) Interest expense 2,285 1,096 Loss on extinguishment of debt — 1,027 Change in fair value of Additional Shares liability 2,015 — Change in fair value of Earn-Out liability (17,345) — Change in fair value of Public and Private Placement Warrants liability (1,180) — Other expense, net 6,775 268 Interest and other expense, net (7,450) 2,391 Loss before provision for income taxes (35,308) (28,500) Provision for income taxes 2 16 Net Loss $ (35,310) $ (28,516)
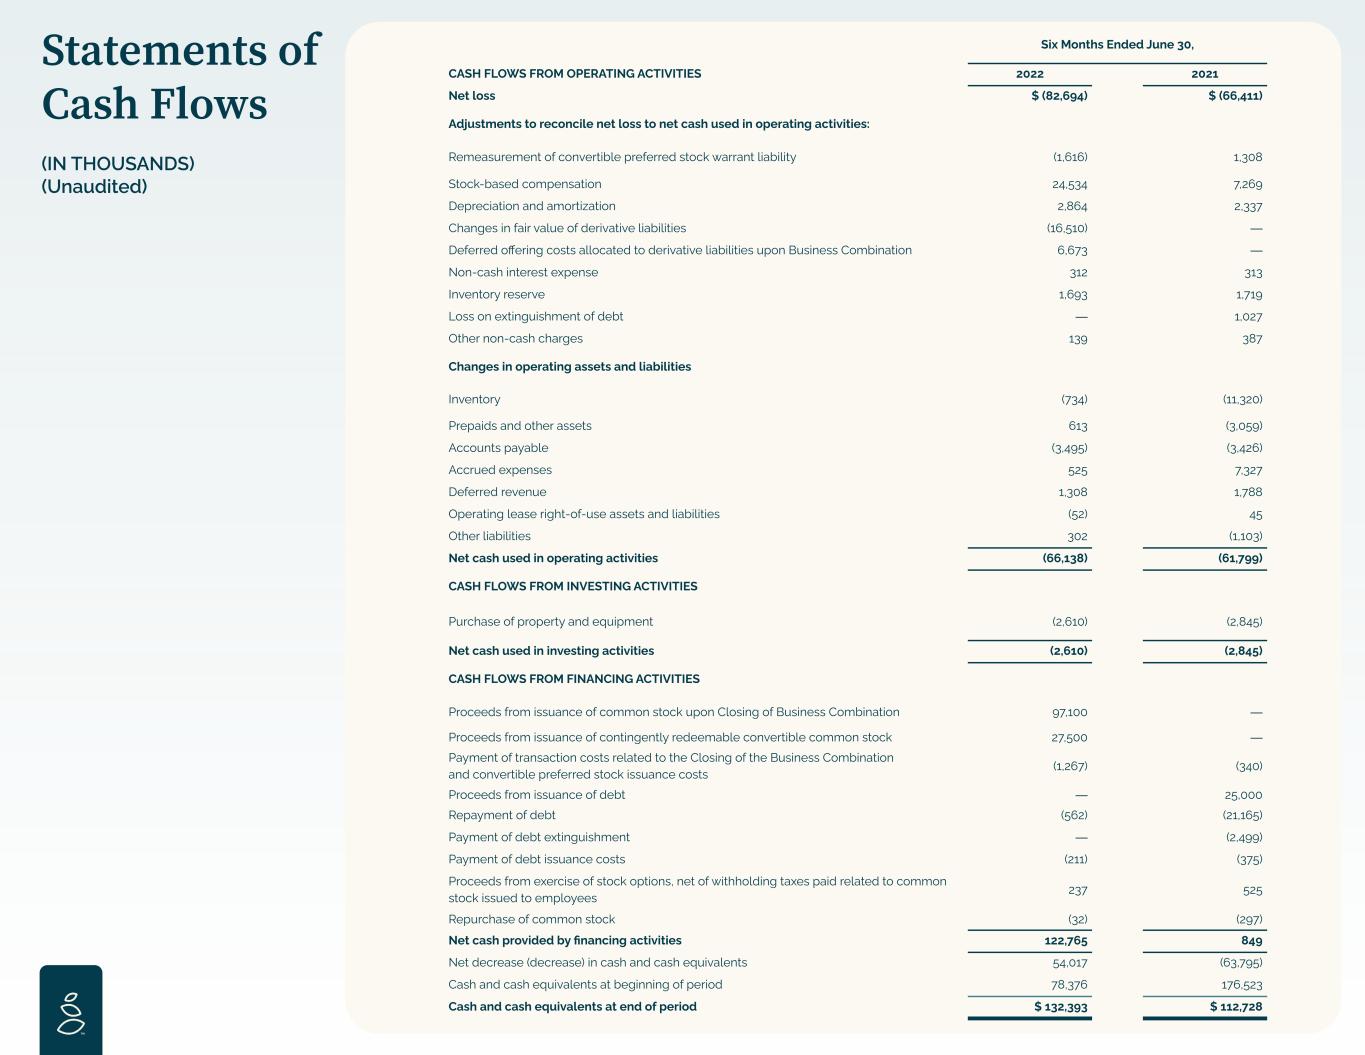
Statements of Cash Flows (IN THOUSANDS) (Unaudited) Six Months Ended June 30, CASH FLOWS FROM OPERATING ACTIVITIES 2022 2021 Net loss $ (82,694) $ (66,411) Adjustments to reconcile net loss to net cash used in operating activities: Remeasurement of convertible preferred stock warrant liability (1,616) 1,308 Stock-based compensation 24,534 7,269 Depreciation and amortization 2,864 2,337 Changes in fair value of derivative liabilities (16,510) — Deferred offering costs allocated to derivative liabilities upon Business Combination 6,673 — Non-cash interest expense 312 313 Inventory reserve 1,693 1,719 Loss on extinguishment of debt — 1,027 Other non-cash charges 139 387 Changes in operating assets and liabilities Inventory (734) (11,320) Prepaids and other assets 613 (3,059) Accounts payable (3,495) (3,426) Accrued expenses 525 7,327 Deferred revenue 1,308 1,788 Operating lease right-of-use assets and liabilities (52) 45 Other liabilities 302 (1,103) Net cash used in operating activities (66,138) (61,799) CASH FLOWS FROM INVESTING ACTIVITIES Purchase of property and equipment (2,610) (2,845) Net cash used in investing activities (2,610) (2,845) CASH FLOWS FROM FINANCING ACTIVITIES Proceeds from issuance of common stock upon Closing of Business Combination 97,100 — Proceeds from issuance of contingently redeemable convertible common stock 27,500 — Payment of transaction costs related to the Closing of the Business Combination and convertible preferred stock issuance costs (1,267) (340) Proceeds from issuance of debt — 25,000 Repayment of debt (562) (21,165) Payment of debt extinguishment — (2,499) Payment of debt issuance costs (211) (375) Proceeds from exercise of stock options, net of withholding taxes paid related to common stock issued to employees 237 525 Repurchase of common stock (32) (297) Net cash provided by financing activities 122,765 849 Net decrease (decrease) in cash and cash equivalents 54,017 (63,795) Cash and cash equivalents at beginning of period 78,376 176,523 Cash and cash equivalents at end of period $ 132,393 $ 112,728
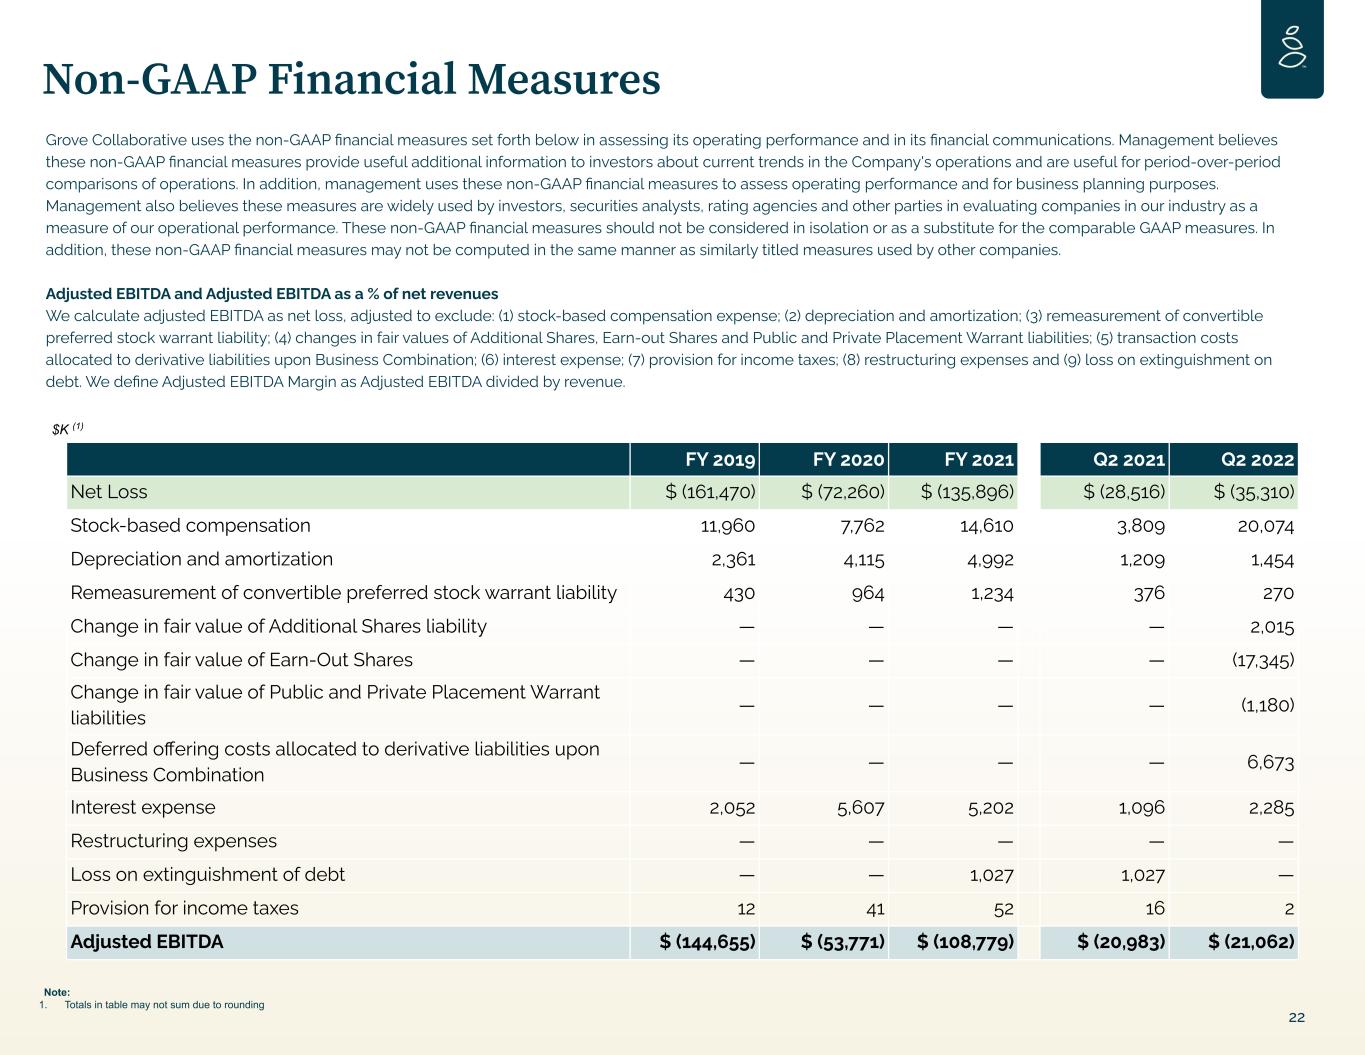
Non-GAAP Financial Measures 22 Grove Collaborative uses the non-GAAP financial measures set forth below in assessing its operating performance and in its financial communications. Management believes these non-GAAP financial measures provide useful additional information to investors about current trends in the Company's operations and are useful for period-over-period comparisons of operations. In addition, management uses these non-GAAP financial measures to assess operating performance and for business planning purposes. Management also believes these measures are widely used by investors, securities analysts, rating agencies and other parties in evaluating companies in our industry as a measure of our operational performance. These non-GAAP financial measures should not be considered in isolation or as a substitute for the comparable GAAP measures. In addition, these non-GAAP financial measures may not be computed in the same manner as similarly titled measures used by other companies. Adjusted EBITDA and Adjusted EBITDA as a % of net revenues We calculate adjusted EBITDA as net loss, adjusted to exclude: (1) stock-based compensation expense; (2) depreciation and amortization; (3) remeasurement of convertible preferred stock warrant liability; (4) changes in fair values of Additional Shares, Earn-out Shares and Public and Private Placement Warrant liabilities; (5) transaction costs allocated to derivative liabilities upon Business Combination; (6) interest expense; (7) provision for income taxes; (8) restructuring expenses and (9) loss on extinguishment on debt. We define Adjusted EBITDA Margin as Adjusted EBITDA divided by revenue. $K (1) Note: 1. Totals in table may not sum due to rounding FY 2019 FY 2020 FY 2021 Q2 2021 Q2 2022 Net Loss $ (161,470) $ (72,260) $ (135,896) $ (28,516) $ (35,310) Stock-based compensation 11,960 7,762 14,610 3,809 20,074 Depreciation and amortization 2,361 4,115 4,992 1,209 1,454 Remeasurement of convertible preferred stock warrant liability 430 964 1,234 376 270 Change in fair value of Additional Shares liability — — — — 2,015 Change in fair value of Earn-Out Shares — — — — (17,345) Change in fair value of Public and Private Placement Warrant liabilities — — — — (1,180) Deferred offering costs allocated to derivative liabilities upon Business Combination — — — — 6,673 Interest expense 2,052 5,607 5,202 1,096 2,285 Restructuring expenses — — — — — Loss on extinguishment of debt — — 1,027 1,027 — Provision for income taxes 12 41 52 16 2 Adjusted EBITDA $ (144,655) $ (53,771) $ (108,779) $ (20,983) $ (21,062)
Thank you