Investor Presentation March 2024 Exhibit 99.2
NOTES START FROM HERE AND GROW UP NO CONTENT BELOW THIS LINE CONTENT BELOW THIS LINE SUBTITLE BELOW THIS LINE TITLE CAN NOT GO ABOVE THIS LINE 3 59 76 0 114 88 120 159 144 130 186 128 102 163 157 172 196 200 255 255 255 0 0 0 247 243 228 3 59 76 247 243 228 2 Forward-Looking Statements Certain statements included in this presentation are forward-looking statements for purposes of the safe harbor provisions under the United States Private Securities Litigation Reform Act of 1995. Forward-looking statements are statements other than statements about historical fact. The forward looking statements in this presentation include, but are not limited to, statements regarding 2024 Adjusted EBITDA profitability and revenue growth, growth in the second half of 2024, growth and profitability in 2025, transformation in 2024, category expansion, customer experience transformation, future product launches, continuing momentum in VMS and the impact of customer experience changes. These forward-looking statements are subject to a number of risks and uncertainties, and you should not rely upon the forward-looking statements as predictions of future events. The future events and trends discussed in this presentation may not occur and actual results could differ materially and adversely from those anticipated or implied in the forward-looking statements. Grove cannot guarantee that future results, levels of activity, performance, achievements or events and circumstances reflected in the forward-looking statements will occur. Except as required by law, Grove disclaims any obligation to update these forward-looking statements to reflect future events or circumstances. The forward-looking statements are subject to a number of risks and uncertainties, including: changes in business, market, financial, political and legal conditions; risks relating to the uncertainty of the projected financial information; Grove’s ability to successfully expand its business; competition; the uncertain effects of the COVID-19 pandemic; risks relating to growing inflation and rising interest rates; and those factors discussed in documents of Grove filed, or to be filed, with the U.S. Securities and Exchange Commission. If any of these risks materialize or our assumptions prove incorrect, actual results could differ materially from the results implied by these forward-looking statements. These forward-looking statements should not be relied upon as representing Grove’s assessments as of any date subsequent to the date of this presentation. Non-GAAP Information Grove uses certain non-GAAP measures in this presentation including Adjusted EBITDA. Grove believes the presentation of its non-GAAP financial measures enhances investors' overall understanding of the company's historical financial performance. The presentation of the company's non-GAAP financial measures is not meant to be considered in isolation or as a substitute for the company's financial results prepared in accordance with GAAP, and the company's non-GAAP measures may be different from non-GAAP measures used by other companies. Reconciliations of these non-GAAP financial measures to the most comparable GAAP measures, may be found in the Supplemental Materials at the end of this presentation. Safe Harbor Statement/Non-GAAP Measures
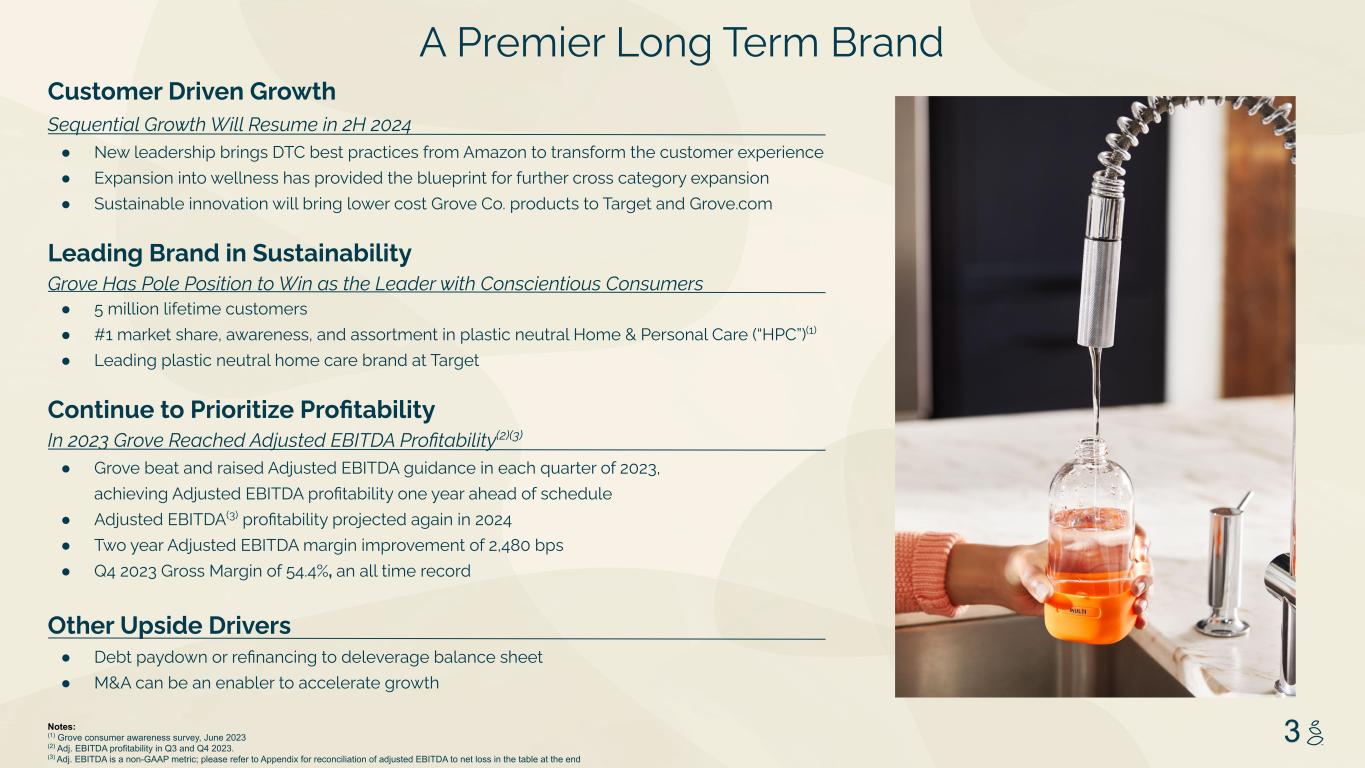
NOTES START FROM HERE AND GROW UP NO CONTENT BELOW THIS LINE CONTENT BELOW THIS LINE SUBTITLE BELOW THIS LINE TITLE CAN NOT GO ABOVE THIS LINE 3 59 76 0 114 88 120 159 144 130 186 128 102 163 157 172 196 200 255 255 255 0 0 0 247 243 228 3 59 76 247 243 228 3 Customer Driven Growth Sequential Growth Will Resume in 2H 2024 ● New leadership brings DTC best practices from Amazon to transform the customer experience ● Expansion into wellness has provided the blueprint for further cross category expansion ● Sustainable innovation will bring lower cost Grove Co. products to Target and Grove.com Leading Brand in Sustainability Grove Has Pole Position to Win as the Leader with Conscientious Consumers ● 5 million lifetime customers ● #1 market share, awareness, and assortment in plastic neutral Home & Personal Care (“HPC”)(1) ● Leading plastic neutral home care brand at Target Continue to Prioritize Profitability In 2023 Grove Reached Adjusted EBITDA Profitability(2)(3) ● Grove beat and raised Adjusted EBITDA guidance in each quarter of 2023, achieving Adjusted EBITDA profitability one year ahead of schedule ● Adjusted EBITDA(3) profitability projected again in 2024 ● Two year Adjusted EBITDA margin improvement of 2,480 bps ● Q4 2023 Gross Margin of 54.4%, an all time record Other Upside Drivers ● Debt paydown or refinancing to deleverage balance sheet ● M&A can be an enabler to accelerate growth A Premier Long Term Brand Notes: (1) Grove consumer awareness survey, June 2023 (2) Adj. EBITDA profitability in Q3 and Q4 2023. (3) Adj. EBITDA is a non-GAAP metric; please refer to Appendix for reconciliation of adjusted EBITDA to net loss in the table at the end
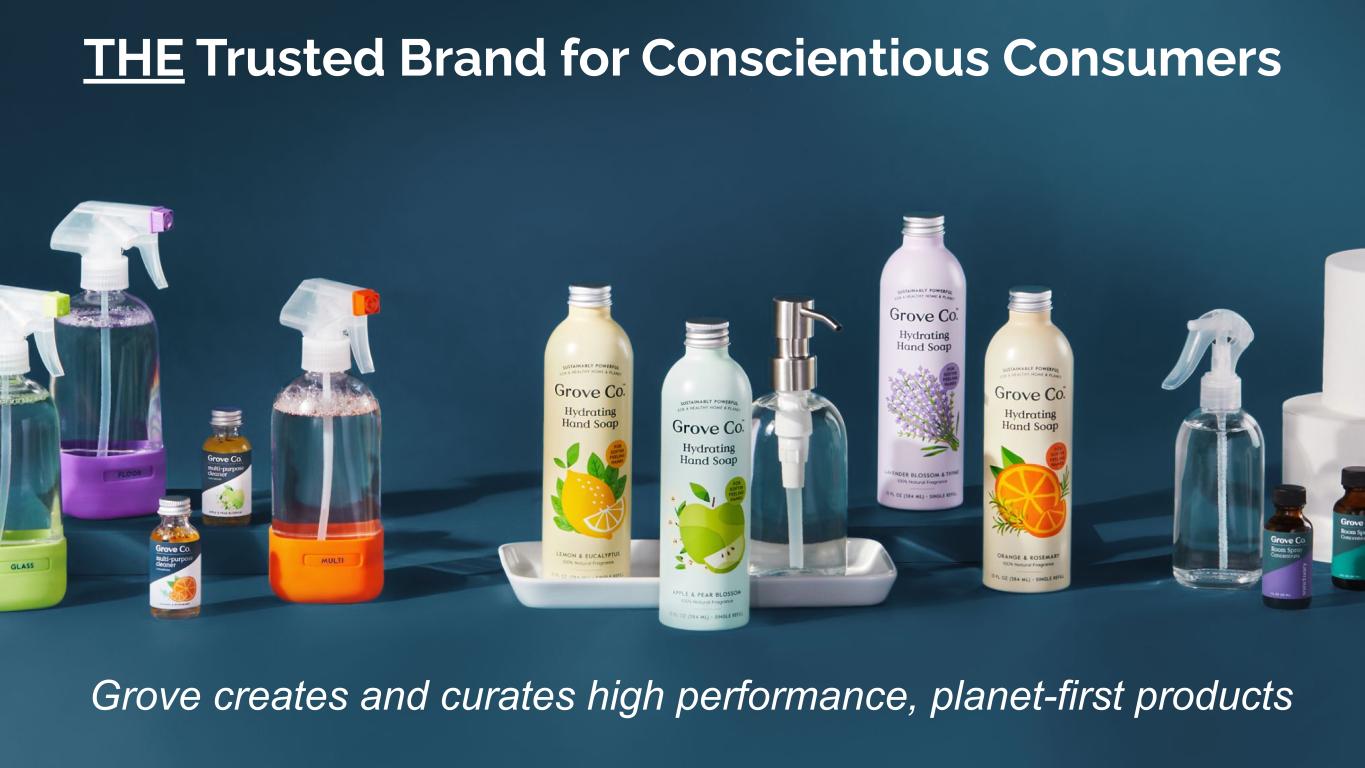
NOTES START FROM HERE AND GROW UP NO CONTENT BELOW THIS LINE CONTENT BELOW THIS LINE SUBTITLE BELOW THIS LINE TITLE CAN NOT GO ABOVE THIS LINE 3 59 76 0 114 88 120 159 144 130 186 128 102 163 157 172 196 200 255 255 255 0 0 0 247 243 228 3 59 76 247 243 228 4 THE Trusted Brand for Conscientious Consumers Grove creates and curates high performance, planet-first products
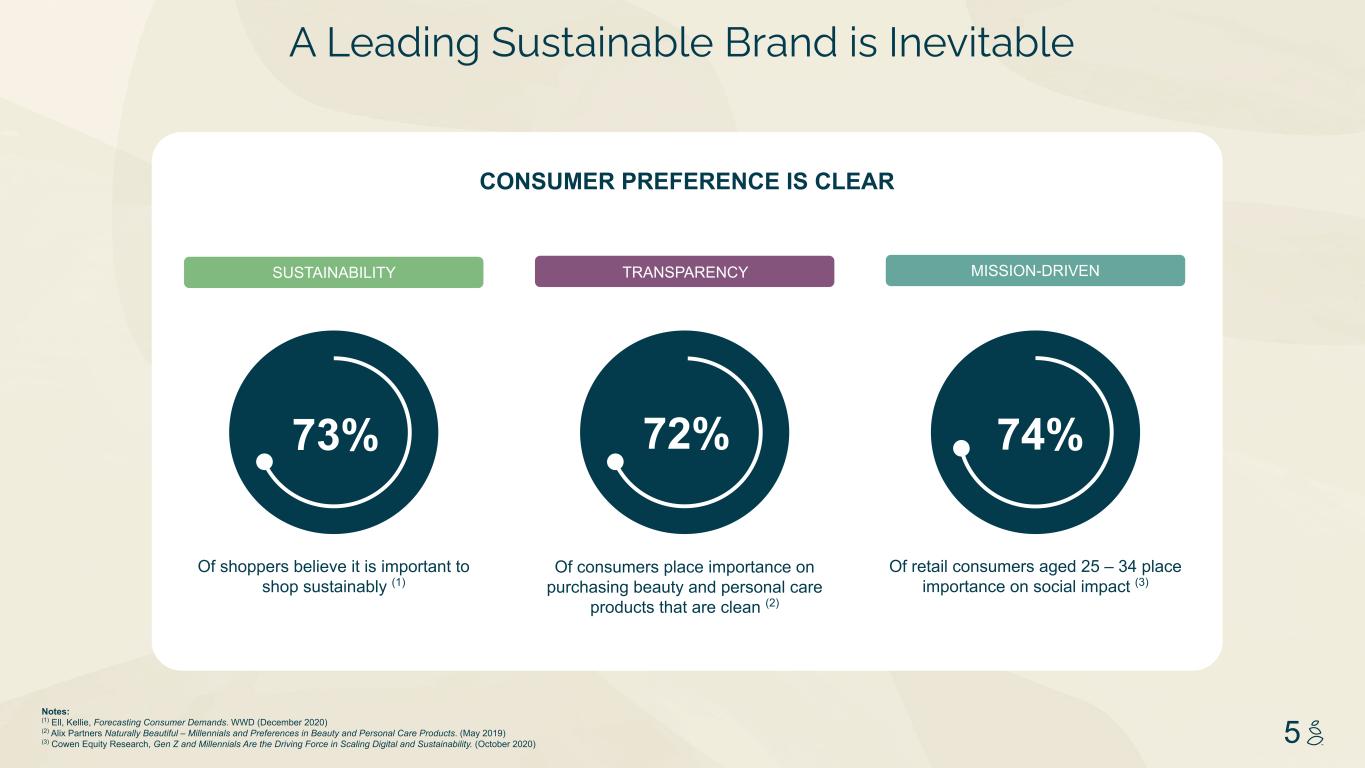
NOTES START FROM HERE AND GROW UP NO CONTENT BELOW THIS LINE CONTENT BELOW THIS LINE SUBTITLE BELOW THIS LINE TITLE CAN NOT GO ABOVE THIS LINE 3 59 76 0 114 88 120 159 144 130 186 128 102 163 157 172 196 200 255 255 255 0 0 0 247 243 228 3 59 76 247 243 228 5 A Leading Sustainable Brand is Inevitable Notes: (1) Ell, Kellie, Forecasting Consumer Demands. WWD (December 2020) (2) Alix Partners Naturally Beautiful – Millennials and Preferences in Beauty and Personal Care Products. (May 2019) (3) Cowen Equity Research, Gen Z and Millennials Are the Driving Force in Scaling Digital and Sustainability. (October 2020) Of retail consumers aged 25 – 34 place importance on social impact (3) Of consumers place importance on purchasing beauty and personal care products that are clean (2) TRANSPARENCY Of shoppers believe it is important to shop sustainably (1) SUSTAINABILITY CONSUMER PREFERENCE IS CLEAR MISSION-DRIVEN 74%72%73%
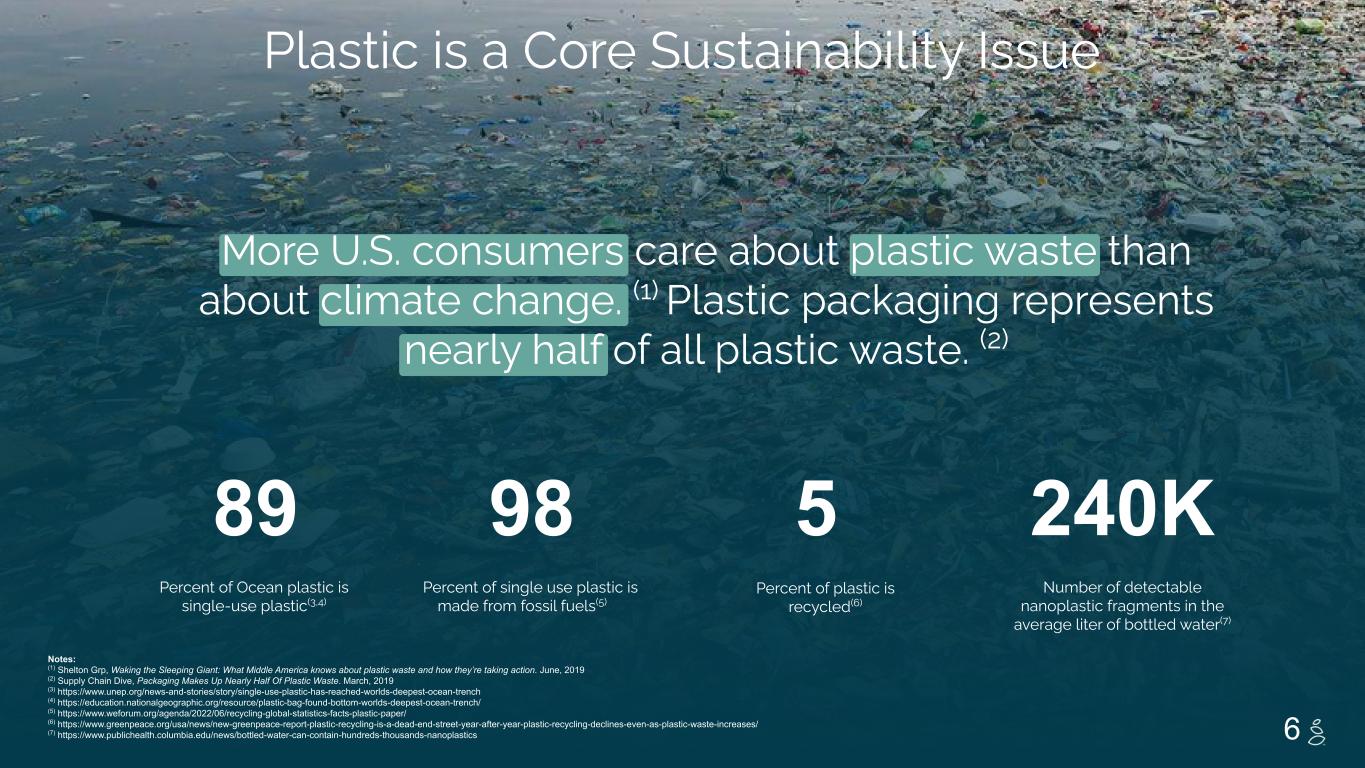
NOTES START FROM HERE AND GROW UP NO CONTENT BELOW THIS LINE CONTENT BELOW THIS LINE SUBTITLE BELOW THIS LINE TITLE CAN NOT GO ABOVE THIS LINE 3 59 76 0 114 88 120 159 144 130 186 128 102 163 157 172 196 200 255 255 255 0 0 0 247 243 228 3 59 76 247 243 228 6 Percent of single use plastic is made from fossil fuels(5) Percent of Ocean plastic is single-use plastic(3,4) Number of detectable nanoplastic fragments in the average liter of bottled water(7) Percent of plastic is recycled(6) Notes: (1) Shelton Grp, Waking the Sleeping Giant: What Middle America knows about plastic waste and how they’re taking action. June, 2019 (2) Supply Chain Dive, Packaging Makes Up Nearly Half Of Plastic Waste. March, 2019 (3) https://www.unep.org/news-and-stories/story/single-use-plastic-has-reached-worlds-deepest-ocean-trench (4) https://education.nationalgeographic.org/resource/plastic-bag-found-bottom-worlds-deepest-ocean-trench/ (5) https://www.weforum.org/agenda/2022/06/recycling-global-statistics-facts-plastic-paper/ (6) https://www.greenpeace.org/usa/news/new-greenpeace-report-plastic-recycling-is-a-dead-end-street-year-after-year-plastic-recycling-declines-even-as-plastic-waste-increases/ (7) https://www.publichealth.columbia.edu/news/bottled-water-can-contain-hundreds-thousands-nanoplastics 89 98 5 240K More U.S. consumers care about plastic waste than about climate change. (1) Plastic packaging represents nearly half of all plastic waste. (2) Plastic is a Core Sustainability Issue
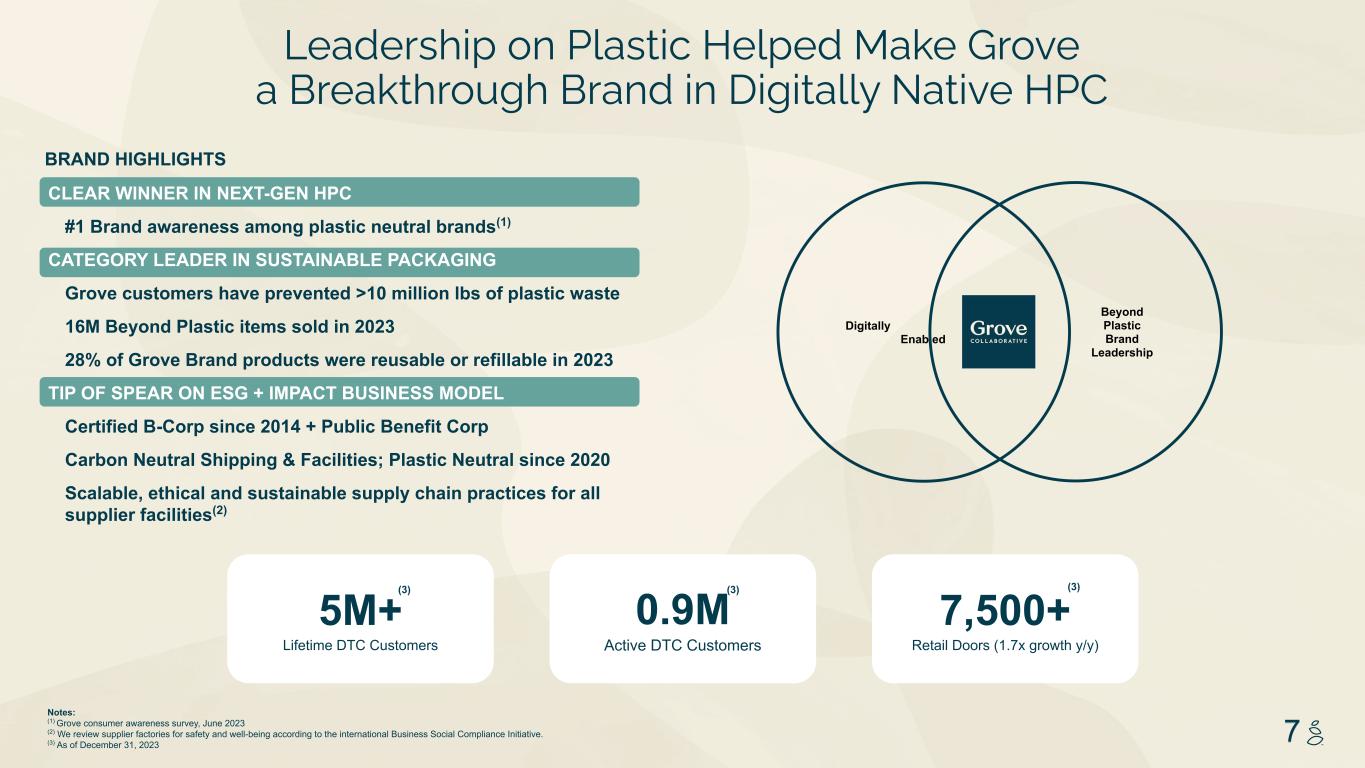
NOTES START FROM HERE AND GROW UP NO CONTENT BELOW THIS LINE CONTENT BELOW THIS LINE SUBTITLE BELOW THIS LINE TITLE CAN NOT GO ABOVE THIS LINE 3 59 76 0 114 88 120 159 144 130 186 128 102 163 157 172 196 200 255 255 255 0 0 0 247 243 228 3 59 76 247 243 228 7 Leadership on Plastic Helped Make Grove a Breakthrough Brand in Digitally Native HPC BRAND HIGHLIGHTS Notes: (1) Grove consumer awareness survey, June 2023 (2) We review supplier factories for safety and well-being according to the international Business Social Compliance Initiative. (3) As of December 31, 2023 Digitally Enabled 0.9M Active DTC Customers 5M+ Lifetime DTC Customers 7,500+ Retail Doors (1.7x growth y/y) (3) (3)(3) Beyond Plastic Brand Leadership CLEAR WINNER IN NEXT-GEN HPC #1 Brand awareness among plastic neutral brands(1) CATEGORY LEADER IN SUSTAINABLE PACKAGING Grove customers have prevented >10 million lbs of plastic waste 16M Beyond Plastic items sold in 2023 28% of Grove Brand products were reusable or refillable in 2023 TIP OF SPEAR ON ESG + IMPACT BUSINESS MODEL Certified B-Corp since 2014 + Public Benefit Corp Carbon Neutral Shipping & Facilities; Plastic Neutral since 2020 Scalable, ethical and sustainable supply chain practices for all supplier facilities(2)
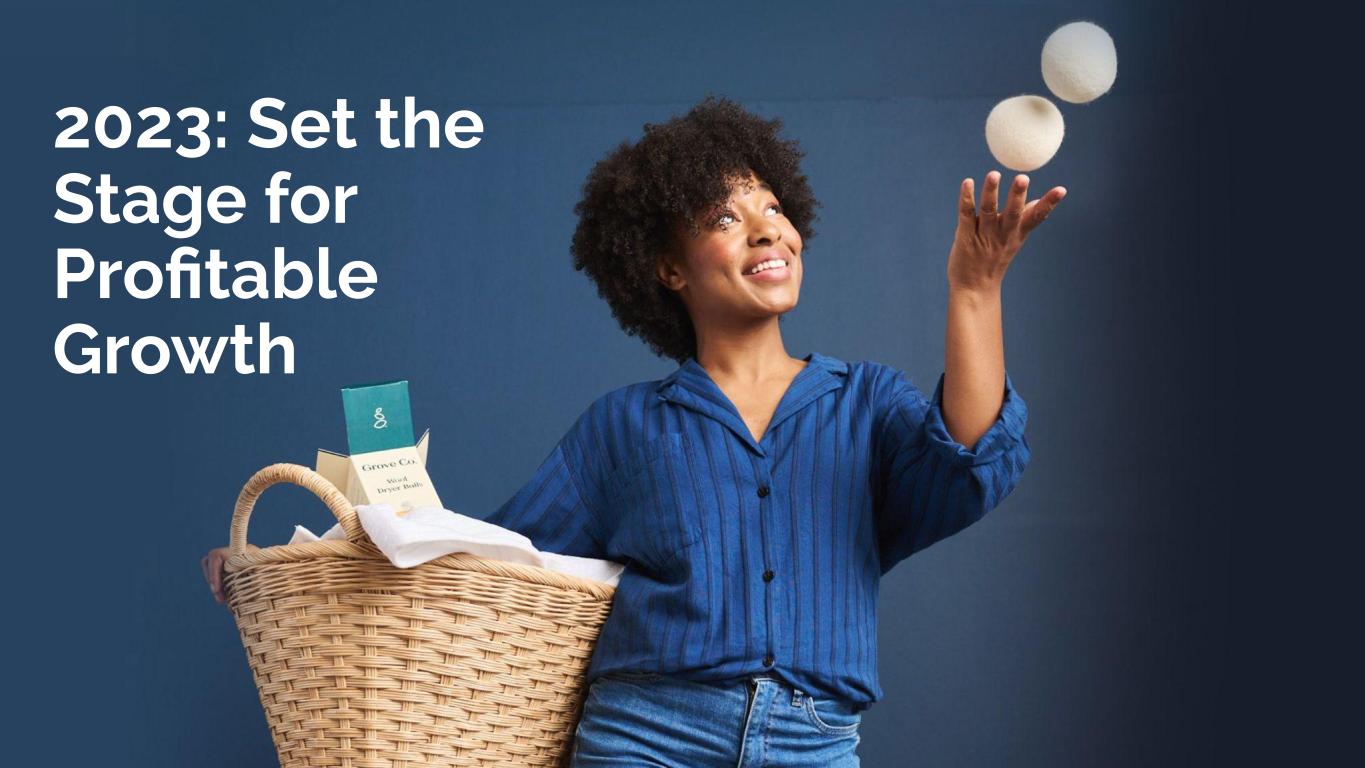
NOTES START FROM HERE AND GROW UP NO CONTENT BELOW THIS LINE CONTENT BELOW THIS LINE SUBTITLE BELOW THIS LINE TITLE CAN NOT GO ABOVE THIS LINE 3 59 76 0 114 88 120 159 144 130 186 128 102 163 157 172 196 200 255 255 255 0 0 0 247 243 228 3 59 76 247 243 228 8 2023: Set the Stage for Profitable Growth
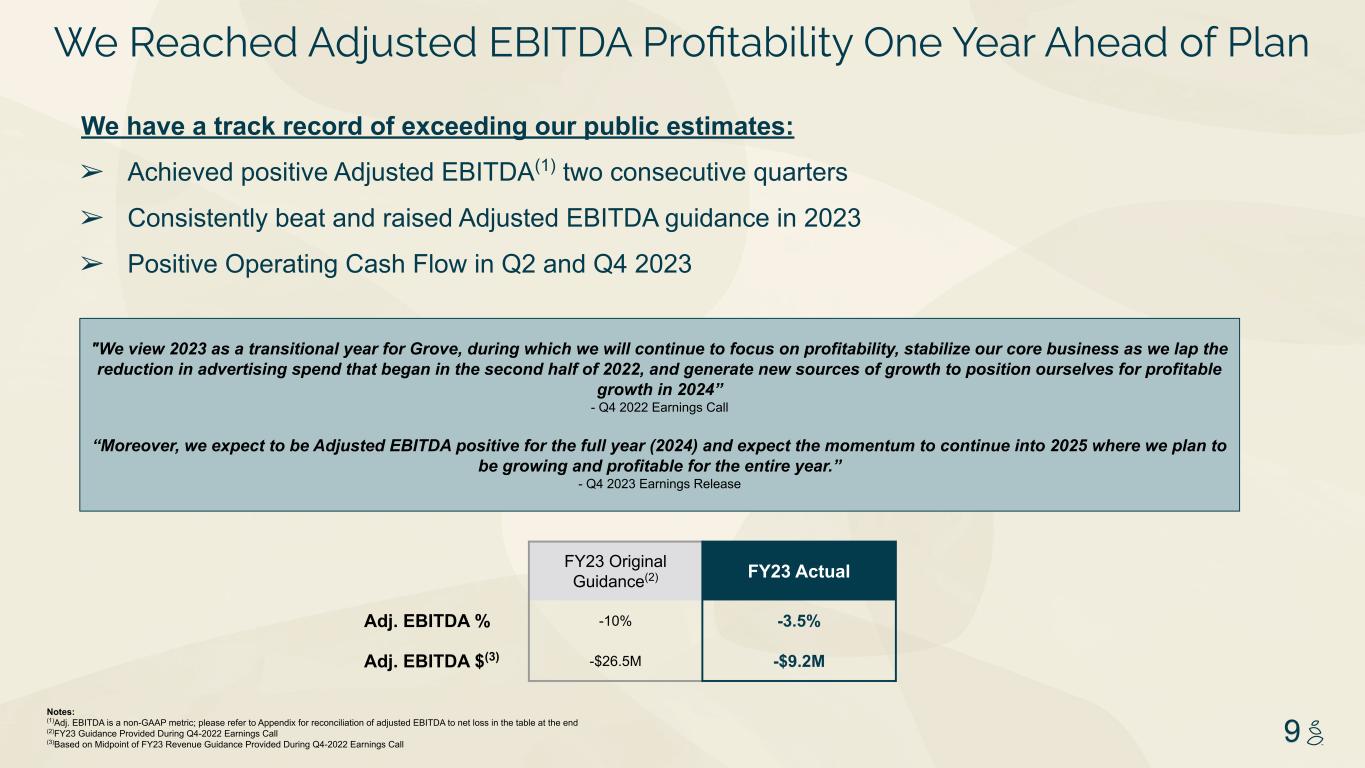
NOTES START FROM HERE AND GROW UP NO CONTENT BELOW THIS LINE CONTENT BELOW THIS LINE SUBTITLE BELOW THIS LINE TITLE CAN NOT GO ABOVE THIS LINE 3 59 76 0 114 88 120 159 144 130 186 128 102 163 157 172 196 200 255 255 255 0 0 0 247 243 228 3 59 76 247 243 228 9 FY23 Original Guidance(2) FY23 Actual Adj. EBITDA % -10% -3.5% Adj. EBITDA $(3) -$26.5M -$9.2M "We view 2023 as a transitional year for Grove, during which we will continue to focus on profitability, stabilize our core business as we lap the reduction in advertising spend that began in the second half of 2022, and generate new sources of growth to position ourselves for profitable growth in 2024” - Q4 2022 Earnings Call “Moreover, we expect to be Adjusted EBITDA positive for the full year (2024) and expect the momentum to continue into 2025 where we plan to be growing and profitable for the entire year.” - Q4 2023 Earnings Release We Reached Adjusted EBITDA Profitability One Year Ahead of Plan Notes: (1)Adj. EBITDA is a non-GAAP metric; please refer to Appendix for reconciliation of adjusted EBITDA to net loss in the table at the end (2)FY23 Guidance Provided During Q4-2022 Earnings Call (3)Based on Midpoint of FY23 Revenue Guidance Provided During Q4-2022 Earnings Call We have a track record of exceeding our public estimates: ➢ Achieved positive Adjusted EBITDA(1) two consecutive quarters ➢ Consistently beat and raised Adjusted EBITDA guidance in 2023 ➢ Positive Operating Cash Flow in Q2 and Q4 2023
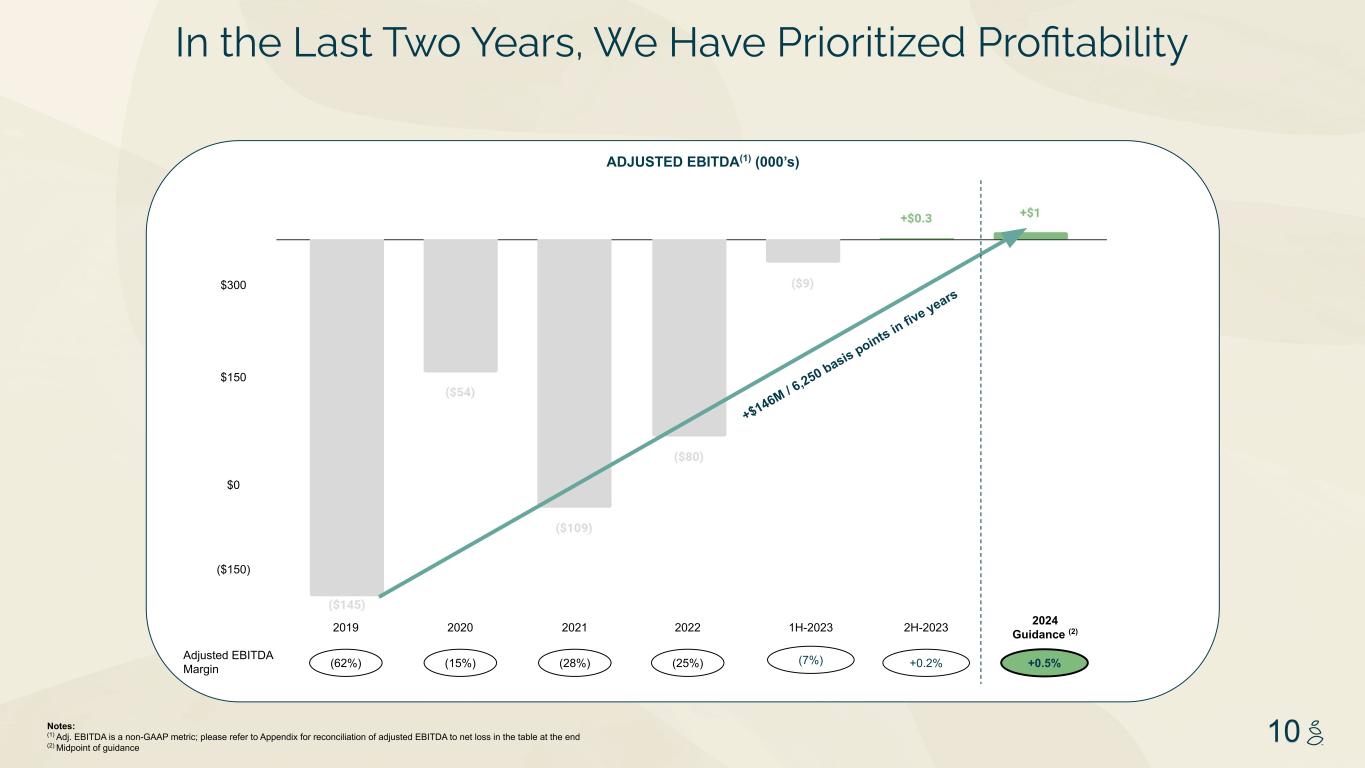
NOTES START FROM HERE AND GROW UP NO CONTENT BELOW THIS LINE CONTENT BELOW THIS LINE SUBTITLE BELOW THIS LINE TITLE CAN NOT GO ABOVE THIS LINE 3 59 76 0 114 88 120 159 144 130 186 128 102 163 157 172 196 200 255 255 255 0 0 0 247 243 228 3 59 76 247 243 228 10Notes: (1) Adj. EBITDA is a non-GAAP metric; please refer to Appendix for reconciliation of adjusted EBITDA to net loss in the table at the end (2) Midpoint of guidance ADJUSTED EBITDA(1) (000’s) $300 $150 $0 ($150) 2019 2020 2022 (62%) Adjusted EBITDA Margin (15%) (28%) 1H-2023 (7%) 2024 Guidance (2) +0.5% 2021 (25%) 2H-2023 In the Last Two Years, We Have Prioritized Profitability +0.2% +$146M / 6 ,250 basis points in fiv e years
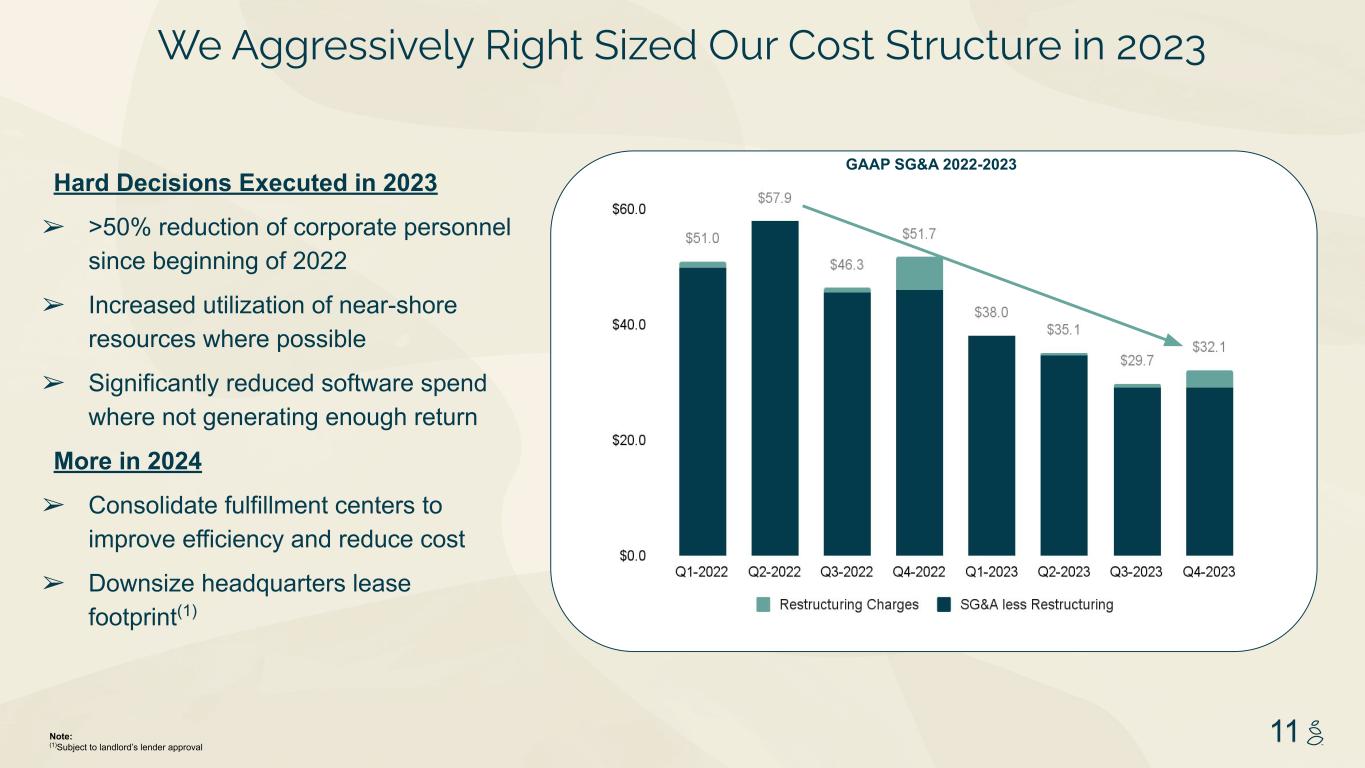
NOTES START FROM HERE AND GROW UP NO CONTENT BELOW THIS LINE CONTENT BELOW THIS LINE SUBTITLE BELOW THIS LINE TITLE CAN NOT GO ABOVE THIS LINE 3 59 76 0 114 88 120 159 144 130 186 128 102 163 157 172 196 200 255 255 255 0 0 0 247 243 228 3 59 76 247 243 228 11 Hard Decisions Executed in 2023 ➢ >50% reduction of corporate personnel since beginning of 2022 ➢ Increased utilization of near-shore resources where possible ➢ Significantly reduced software spend where not generating enough return More in 2024 ➢ Consolidate fulfillment centers to improve efficiency and reduce cost ➢ Downsize headquarters lease footprint(1) Note: (1)Subject to landlord’s lender approval GAAP SG&A 2022-2023 We Aggressively Right Sized Our Cost Structure in 2023
CONFIDENTIAL 2024: Transforming the Business
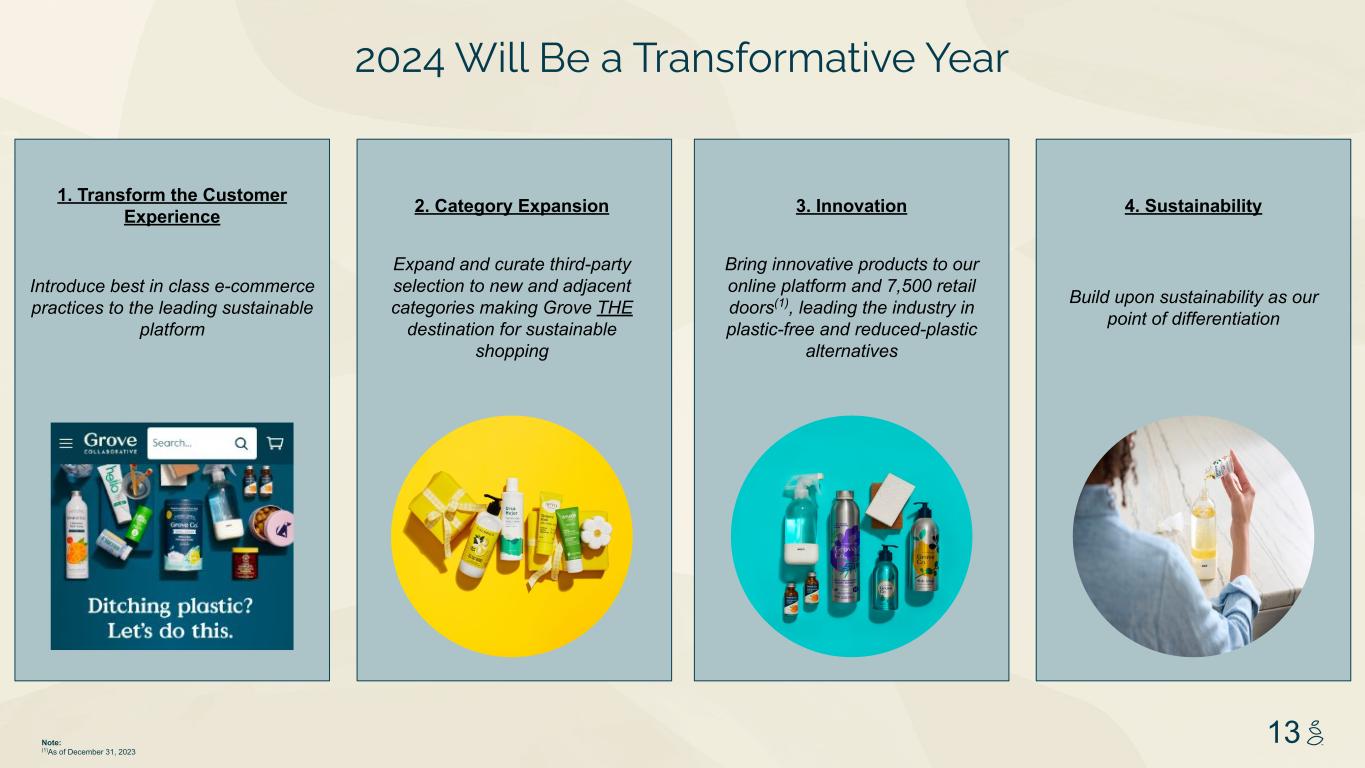
NOTES START FROM HERE AND GROW UP NO CONTENT BELOW THIS LINE CONTENT BELOW THIS LINE SUBTITLE BELOW THIS LINE TITLE CAN NOT GO ABOVE THIS LINE 3 59 76 0 114 88 120 159 144 130 186 128 102 163 157 172 196 200 255 255 255 0 0 0 247 243 228 3 59 76 247 243 228 13Note: (1)As of December 31, 2023 Expand and curate third-party selection to new and adjacent categories making Grove THE destination for sustainable shopping Introduce best in class e-commerce practices to the leading sustainable platform Bring innovative products to our online platform and 7,500 retail doors(1), leading the industry in plastic-free and reduced-plastic alternatives Build upon sustainability as our point of differentiation 2. Category Expansion1. Transform the Customer Experience 3. Innovation 4. Sustainability 2024 Will Be a Transformative Year
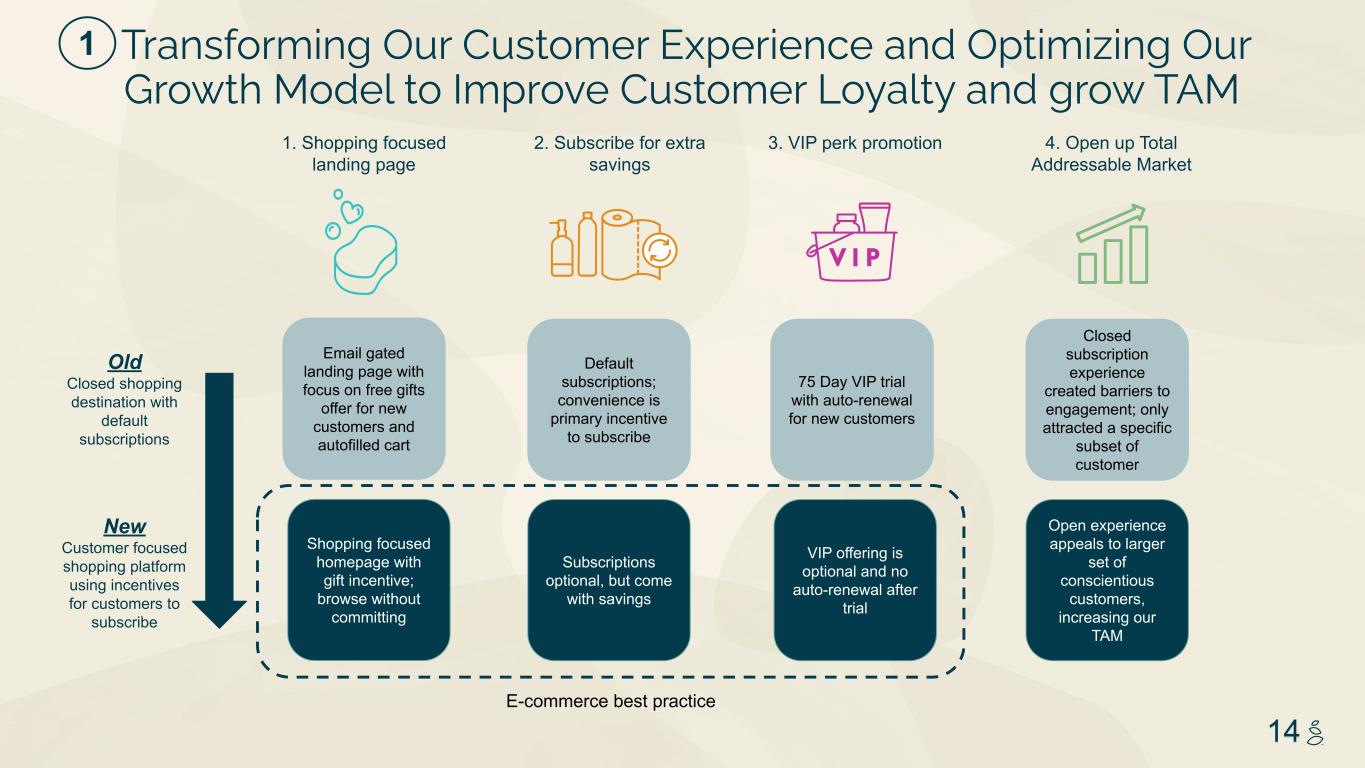
NOTES START FROM HERE AND GROW UP NO CONTENT BELOW THIS LINE CONTENT BELOW THIS LINE SUBTITLE BELOW THIS LINE TITLE CAN NOT GO ABOVE THIS LINE 3 59 76 0 114 88 120 159 144 130 186 128 102 163 157 172 196 200 255 255 255 0 0 0 247 243 228 3 59 76 247 243 228 14 1. Shopping focused landing page 2. Subscribe for extra savings 3. VIP perk promotion 4. Open up Total Addressable Market Shopping focused homepage with gift incentive; browse without committing Subscriptions optional, but come with savings VIP offering is optional and no auto-renewal after trial Open experience appeals to larger set of conscientious customers, increasing our TAM Email gated landing page with focus on free gifts offer for new customers and autofilled cart Default subscriptions; convenience is primary incentive to subscribe 75 Day VIP trial with auto-renewal for new customers Closed subscription experience created barriers to engagement; only attracted a specific subset of customer New Customer focused shopping platform using incentives for customers to subscribe Old Closed shopping destination with default subscriptions E-commerce best practice Transforming Our Customer Experience and Optimizing Our Growth Model to Improve Customer Loyalty and grow TAM 1
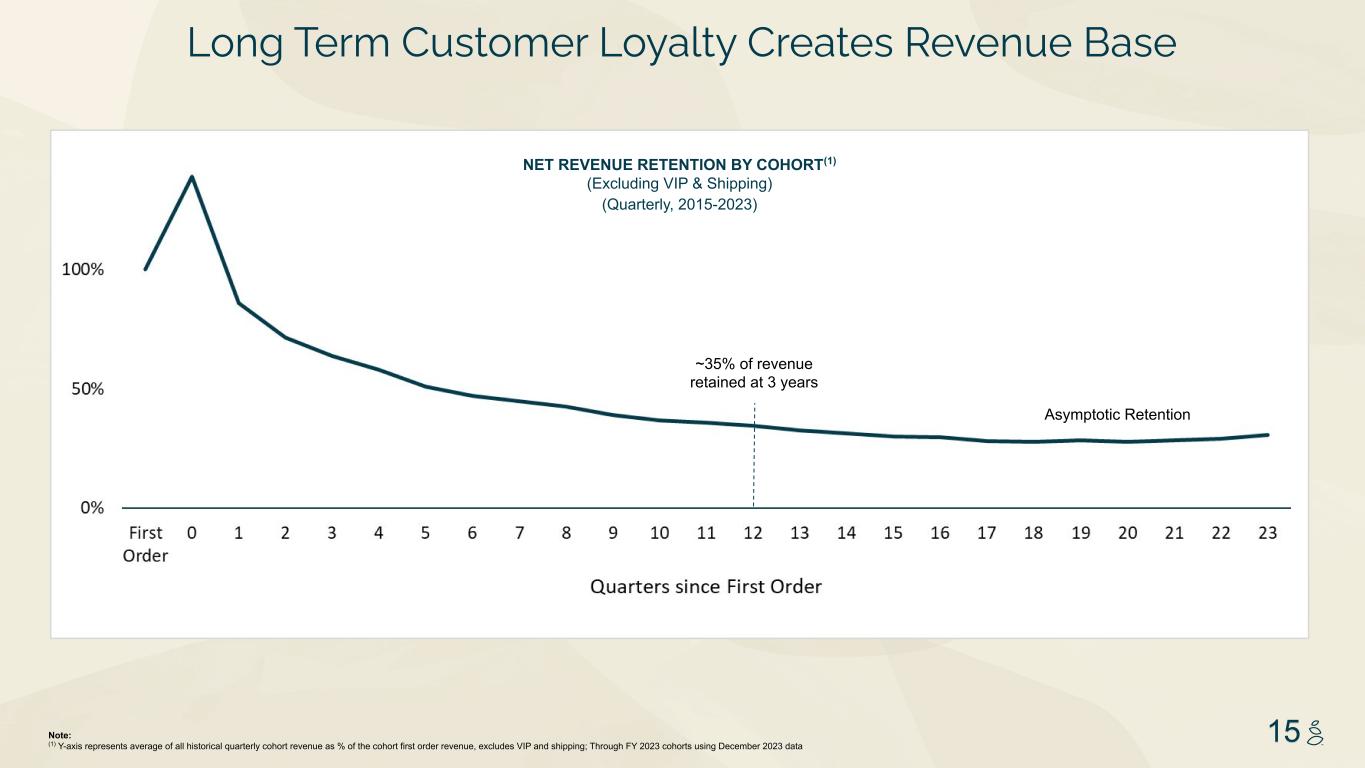
NOTES START FROM HERE AND GROW UP NO CONTENT BELOW THIS LINE CONTENT BELOW THIS LINE SUBTITLE BELOW THIS LINE TITLE CAN NOT GO ABOVE THIS LINE 3 59 76 0 114 88 120 159 144 130 186 128 102 163 157 172 196 200 255 255 255 0 0 0 247 243 228 3 59 76 247 243 228 15Note: (1) Y-axis represents average of all historical quarterly cohort revenue as % of the cohort first order revenue, excludes VIP and shipping; Through FY 2023 cohorts using December 2023 data NET REVENUE RETENTION BY COHORT(1) (Excluding VIP & Shipping) (Quarterly, 2015-2023) Asymptotic Retention Long Term Customer Loyalty Creates Revenue Base ~35% of revenue retained at 3 years
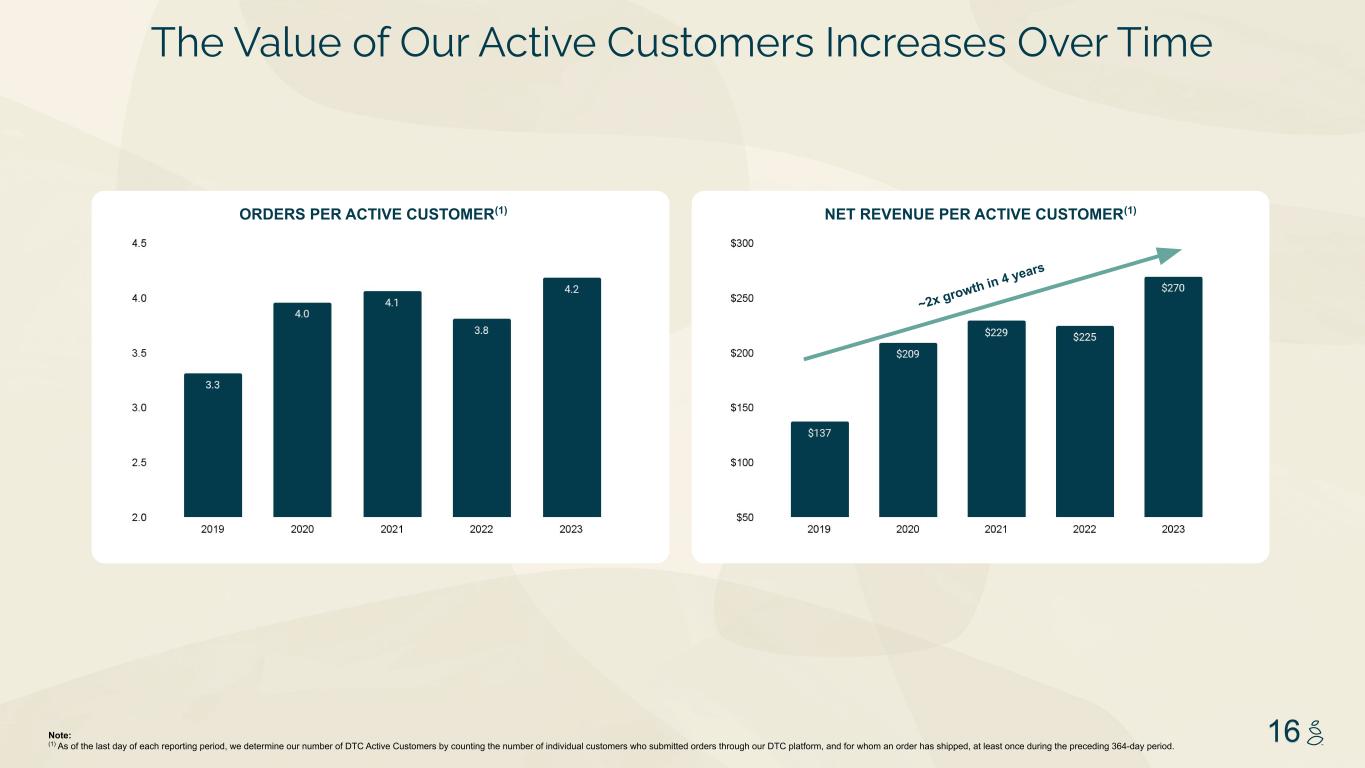
NOTES START FROM HERE AND GROW UP NO CONTENT BELOW THIS LINE CONTENT BELOW THIS LINE SUBTITLE BELOW THIS LINE TITLE CAN NOT GO ABOVE THIS LINE 3 59 76 0 114 88 120 159 144 130 186 128 102 163 157 172 196 200 255 255 255 0 0 0 247 243 228 3 59 76 247 243 228 16 The Value of Our Active Customers Increases Over Time NET REVENUE PER ACTIVE CUSTOMER(1)ORDERS PER ACTIVE CUSTOMER(1) Note: (1) As of the last day of each reporting period, we determine our number of DTC Active Customers by counting the number of individual customers who submitted orders through our DTC platform, and for whom an order has shipped, at least once during the preceding 364-day period. ~2x growth in 4 years
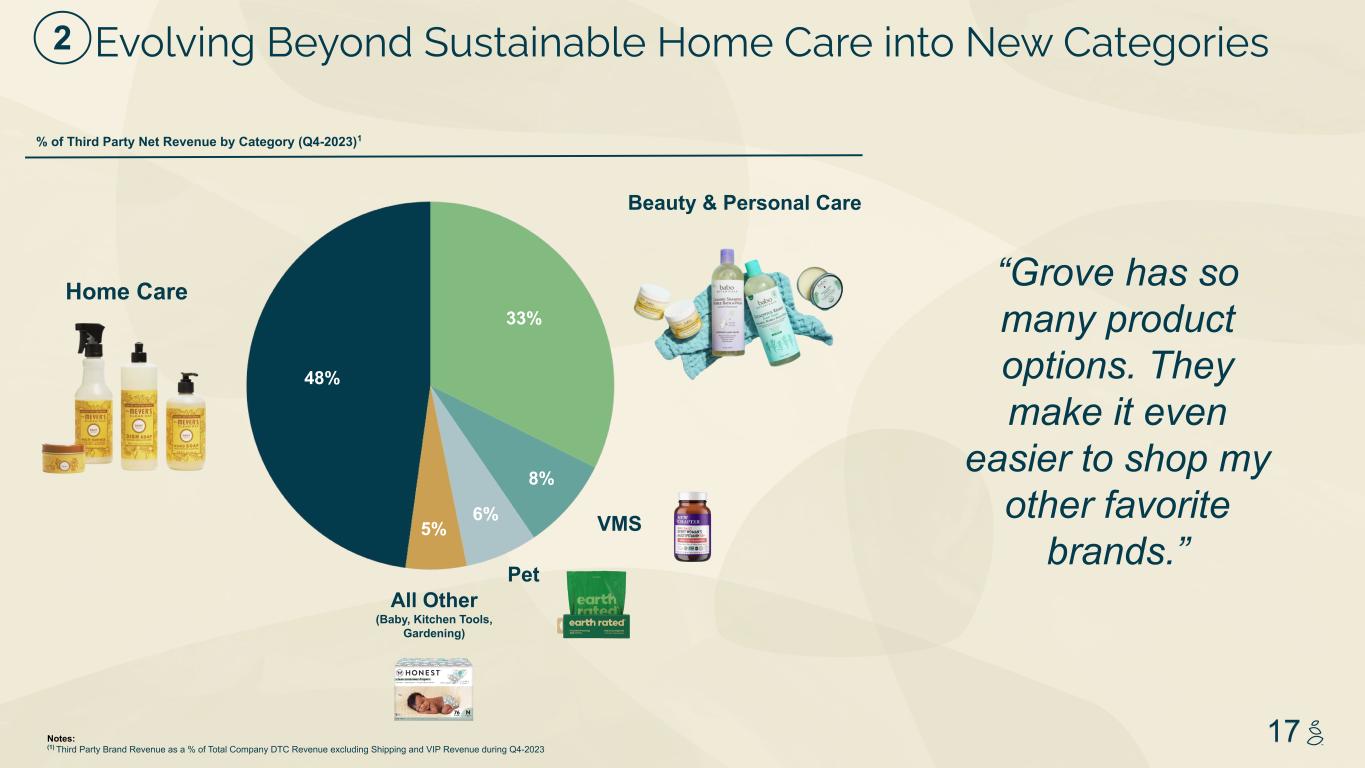
NOTES START FROM HERE AND GROW UP NO CONTENT BELOW THIS LINE CONTENT BELOW THIS LINE SUBTITLE BELOW THIS LINE TITLE CAN NOT GO ABOVE THIS LINE 3 59 76 0 114 88 120 159 144 130 186 128 102 163 157 172 196 200 255 255 255 0 0 0 247 243 228 3 59 76 247 243 228 17 33% 8% 48% 6% 5% Notes: (1) Third Party Brand Revenue as a % of Total Company DTC Revenue excluding Shipping and VIP Revenue during Q4-2023 Home Care Beauty & Personal Care % of Third Party Net Revenue by Category (Q4-2023)1 “Grove has so many product options. They make it even easier to shop my other favorite brands.” Evolving Beyond Sustainable Home Care into New Categories VMS Pet All Other (Baby, Kitchen Tools, Gardening) 2
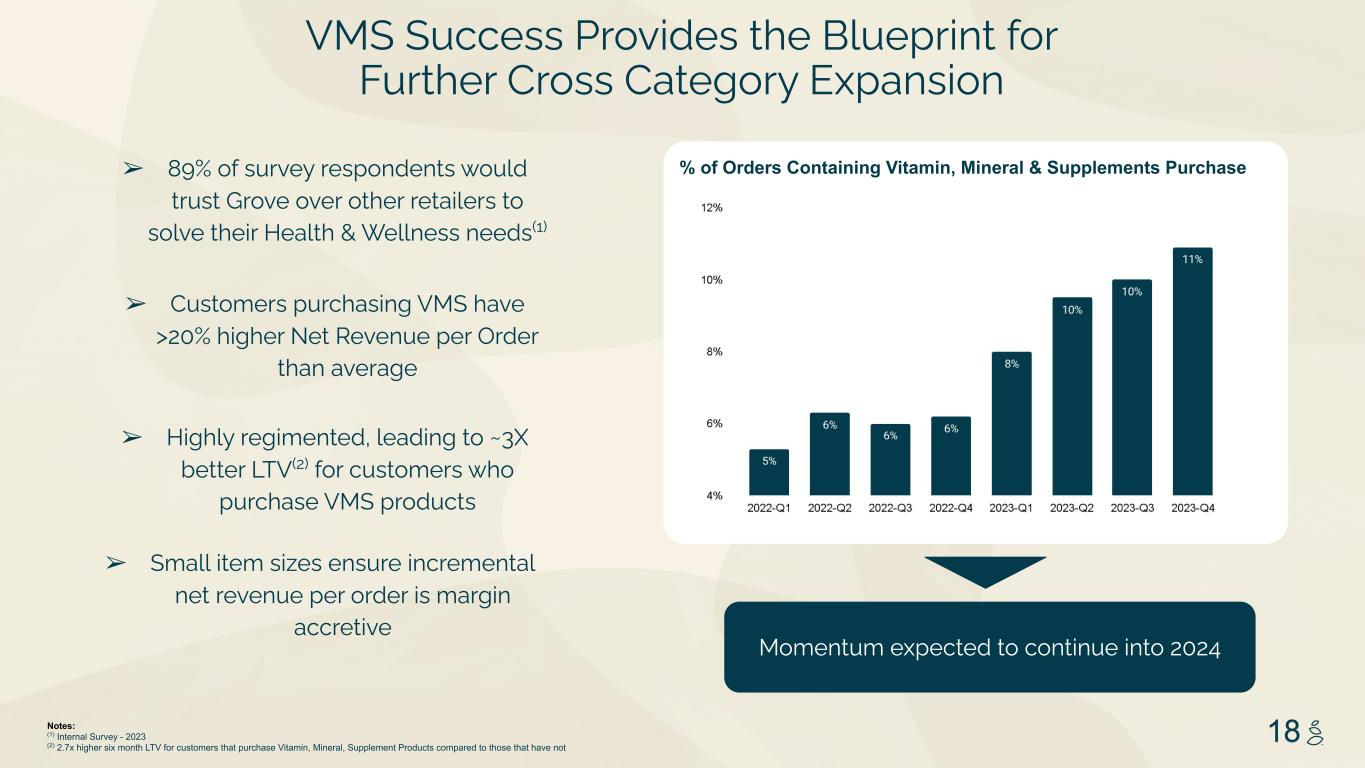
NOTES START FROM HERE AND GROW UP NO CONTENT BELOW THIS LINE CONTENT BELOW THIS LINE SUBTITLE BELOW THIS LINE TITLE CAN NOT GO ABOVE THIS LINE 3 59 76 0 114 88 120 159 144 130 186 128 102 163 157 172 196 200 255 255 255 0 0 0 247 243 228 3 59 76 247 243 228 18 VMS Success Provides the Blueprint for Further Cross Category Expansion % of Orders Containing Vitamin, Mineral & Supplements Purchase ➢ Small item sizes ensure incremental net revenue per order is margin accretive ➢ Highly regimented, leading to ~3X better LTV(2) for customers who purchase VMS products ➢ Customers purchasing VMS have >20% higher Net Revenue per Order than average ➢ 89% of survey respondents would trust Grove over other retailers to solve their Health & Wellness needs(1) Momentum expected to continue into 2024 Notes: (1) Internal Survey - 2023 (2) 2.7x higher six month LTV for customers that purchase Vitamin, Mineral, Supplement Products compared to those that have not
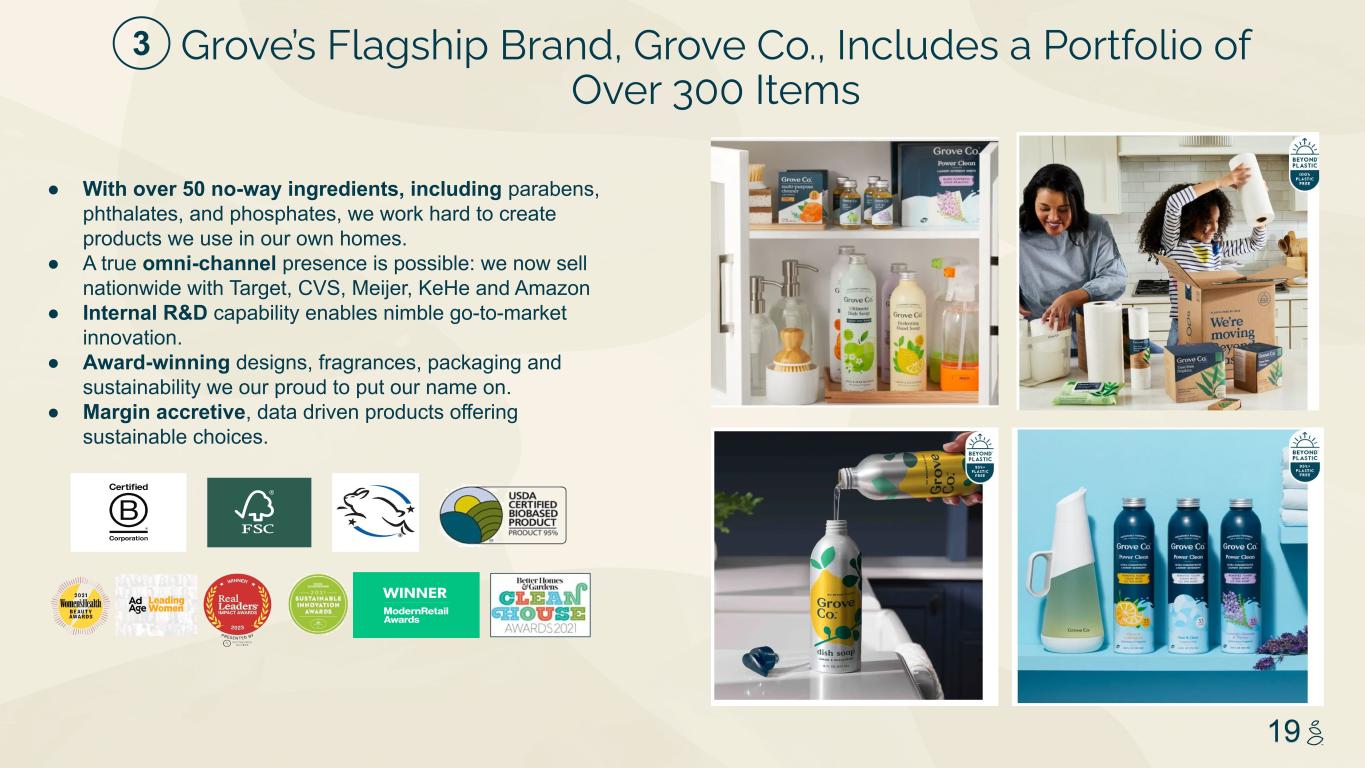
NOTES START FROM HERE AND GROW UP NO CONTENT BELOW THIS LINE CONTENT BELOW THIS LINE SUBTITLE BELOW THIS LINE TITLE CAN NOT GO ABOVE THIS LINE 3 59 76 0 114 88 120 159 144 130 186 128 102 163 157 172 196 200 255 255 255 0 0 0 247 243 228 3 59 76 247 243 228 19 Grove’s Flagship Brand, Grove Co., Includes a Portfolio of Over 300 Items ● With over 50 no-way ingredients, including parabens, phthalates, and phosphates, we work hard to create products we use in our own homes. ● A true omni-channel presence is possible: we now sell nationwide with Target, CVS, Meijer, KeHe and Amazon ● Internal R&D capability enables nimble go-to-market innovation. ● Award-winning designs, fragrances, packaging and sustainability we our proud to put our name on. ● Margin accretive, data driven products offering sustainable choices. 3
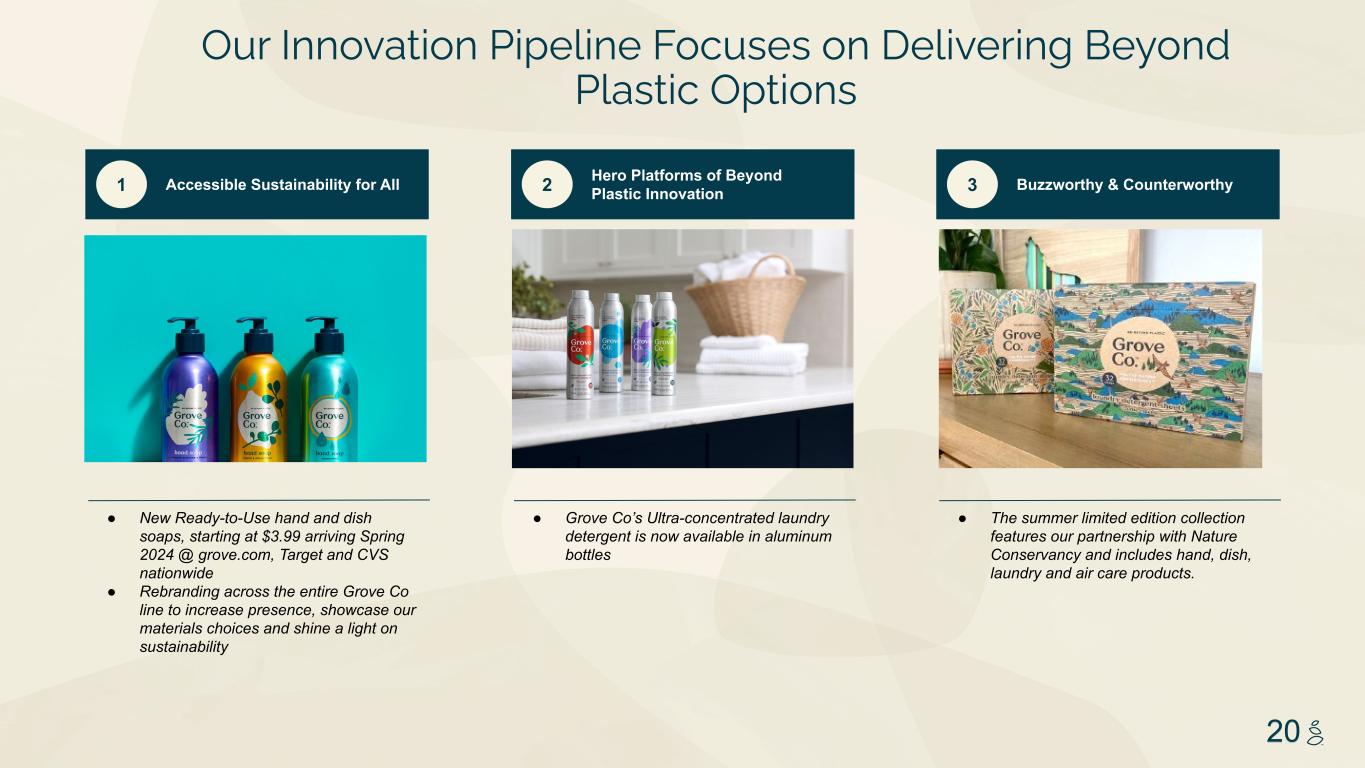
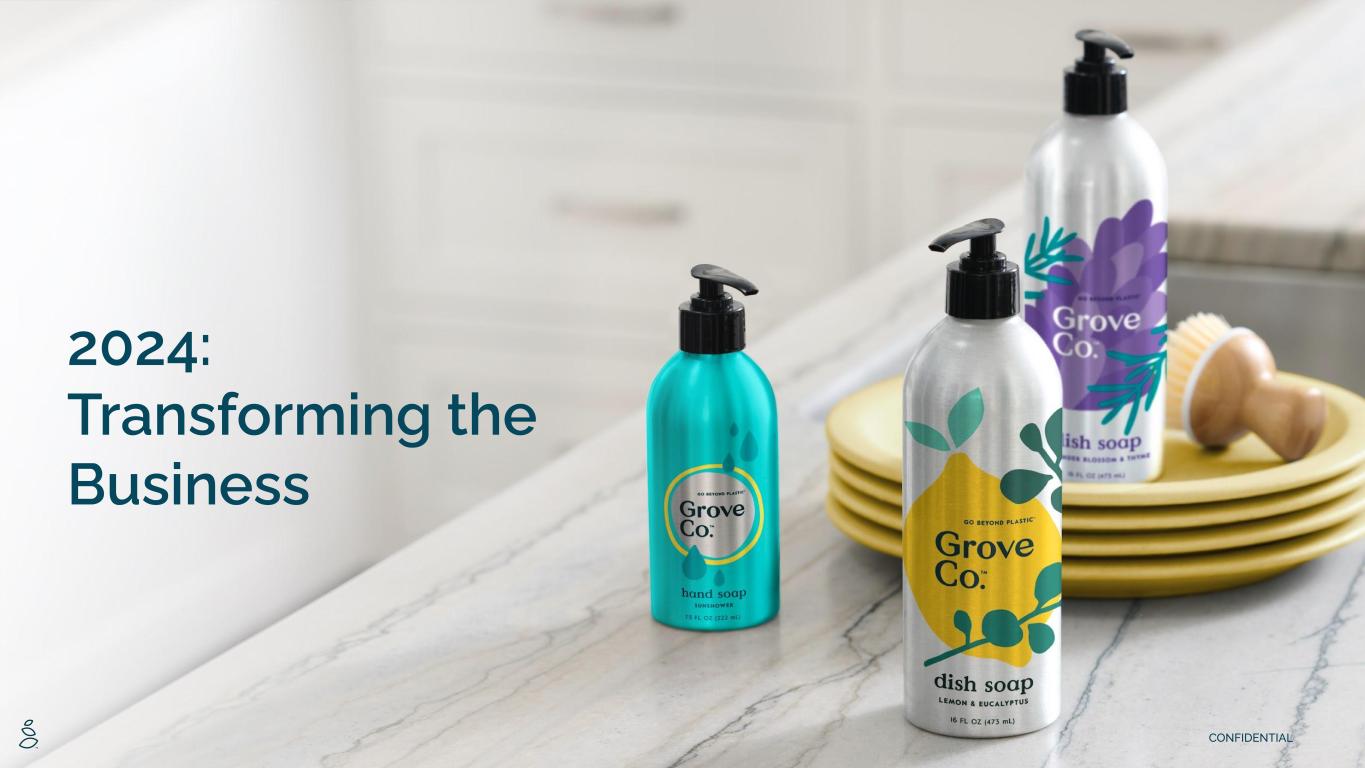
NOTES START FROM HERE AND GROW UP NO CONTENT BELOW THIS LINE CONTENT BELOW THIS LINE SUBTITLE BELOW THIS LINE TITLE CAN NOT GO ABOVE THIS LINE 3 59 76 0 114 88 120 159 144 130 186 128 102 163 157 172 196 200 255 255 255 0 0 0 247 243 228 3 59 76 247 243 228 20 1 Accessible Sustainability for All ● New Ready-to-Use hand and dish soaps, starting at $3.99 arriving Spring 2024 @ grove.com, Target and CVS nationwide ● Rebranding across the entire Grove Co line to increase presence, showcase our materials choices and shine a light on sustainability 2 Hero Platforms of Beyond Plastic Innovation ● Grove Co’s Ultra-concentrated laundry detergent is now available in aluminum bottles 3 Buzzworthy & Counterworthy ● The summer limited edition collection features our partnership with Nature Conservancy and includes hand, dish, laundry and air care products. Our Innovation Pipeline Focuses on Delivering Beyond Plastic Options
NOTES START FROM HERE AND GROW UP NO CONTENT BELOW THIS LINE CONTENT BELOW THIS LINE SUBTITLE BELOW THIS LINE TITLE CAN NOT GO ABOVE THIS LINE 3 59 76 0 114 88 120 159 144 130 186 128 102 163 157 172 196 200 255 255 255 0 0 0 247 243 228 3 59 76 247 243 228 21 Platform for Conscientious Shoppers Can Be Enabled With M&A We evaluate M&A opportunities with our strategic partner, HumanCo. Synergy opportunities include: ➢ Grove.com platform sales of acquired brand ➢ Grove DTC fulfillment capability ➢ Grove in-house marketing capabilities (replace agencies) ➢ Combined retail sales effort Leading Sustainable Platform Strategic Partner + Access to Capital
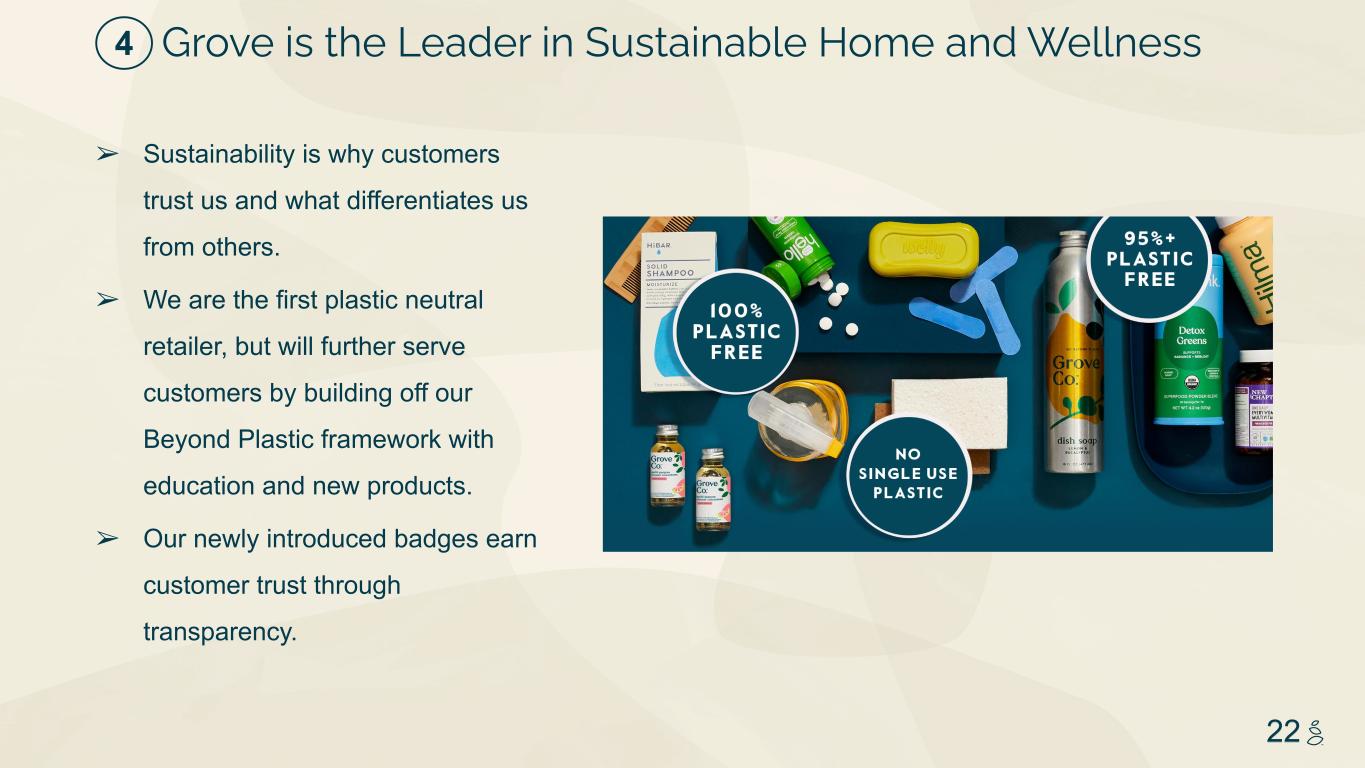
NOTES START FROM HERE AND GROW UP NO CONTENT BELOW THIS LINE CONTENT BELOW THIS LINE SUBTITLE BELOW THIS LINE TITLE CAN NOT GO ABOVE THIS LINE 3 59 76 0 114 88 120 159 144 130 186 128 102 163 157 172 196 200 255 255 255 0 0 0 247 243 228 3 59 76 247 243 228 22 ➢ Sustainability is why customers trust us and what differentiates us from others. ➢ We are the first plastic neutral retailer, but will further serve customers by building off our Beyond Plastic framework with education and new products. ➢ Our newly introduced badges earn customer trust through transparency. Grove is the Leader in Sustainable Home and Wellness4
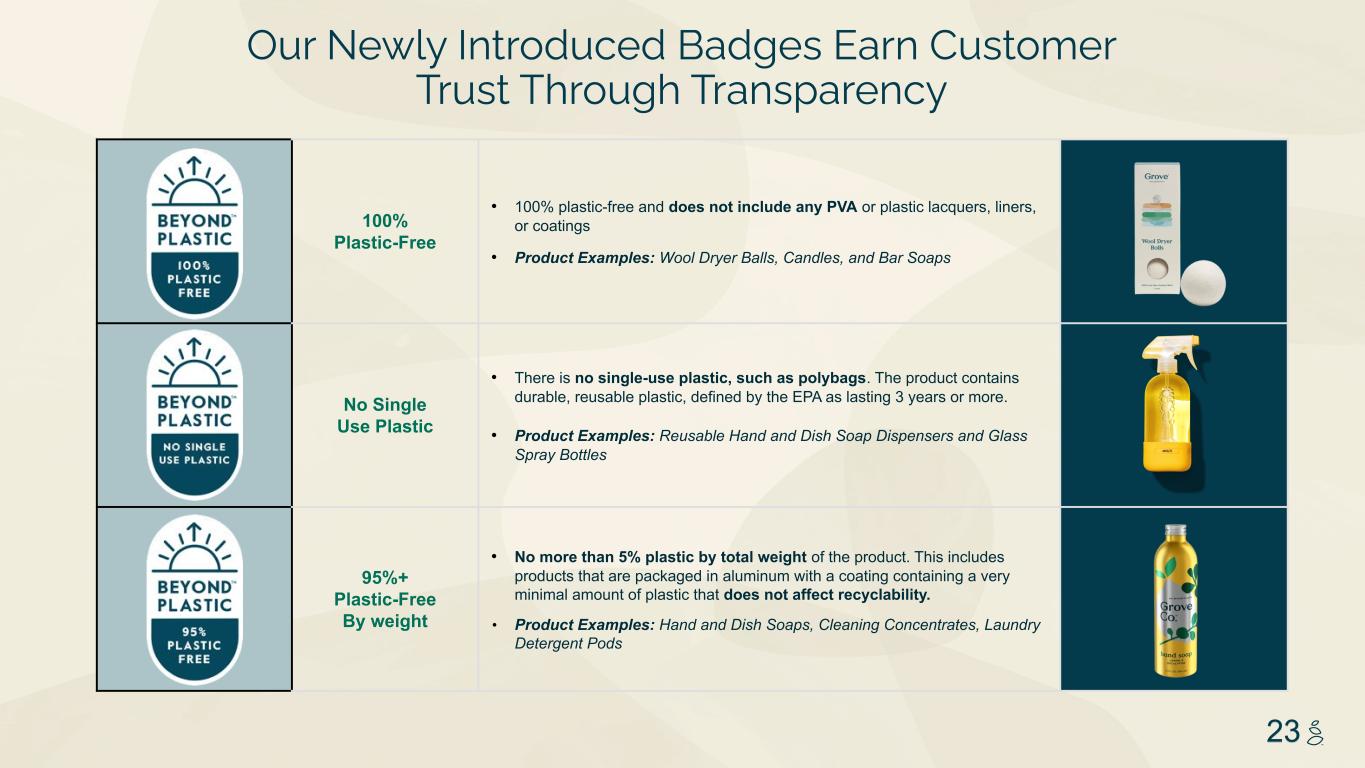
NOTES START FROM HERE AND GROW UP NO CONTENT BELOW THIS LINE CONTENT BELOW THIS LINE SUBTITLE BELOW THIS LINE TITLE CAN NOT GO ABOVE THIS LINE 3 59 76 0 114 88 120 159 144 130 186 128 102 163 157 172 196 200 255 255 255 0 0 0 247 243 228 3 59 76 247 243 228 23 Our Newly Introduced Badges Earn Customer Trust Through Transparency 100% Plastic-Free • 100% plastic-free and does not include any PVA or plastic lacquers, liners, or coatings • Product Examples: Wool Dryer Balls, Candles, and Bar Soaps No Single Use Plastic • There is no single-use plastic, such as polybags. The product contains durable, reusable plastic, defined by the EPA as lasting 3 years or more. • Product Examples: Reusable Hand and Dish Soap Dispensers and Glass Spray Bottles 95%+ Plastic-Free By weight • No more than 5% plastic by total weight of the product. This includes products that are packaged in aluminum with a coating containing a very minimal amount of plastic that does not affect recyclability. • Product Examples: Hand and Dish Soaps, Cleaning Concentrates, Laundry Detergent Pods
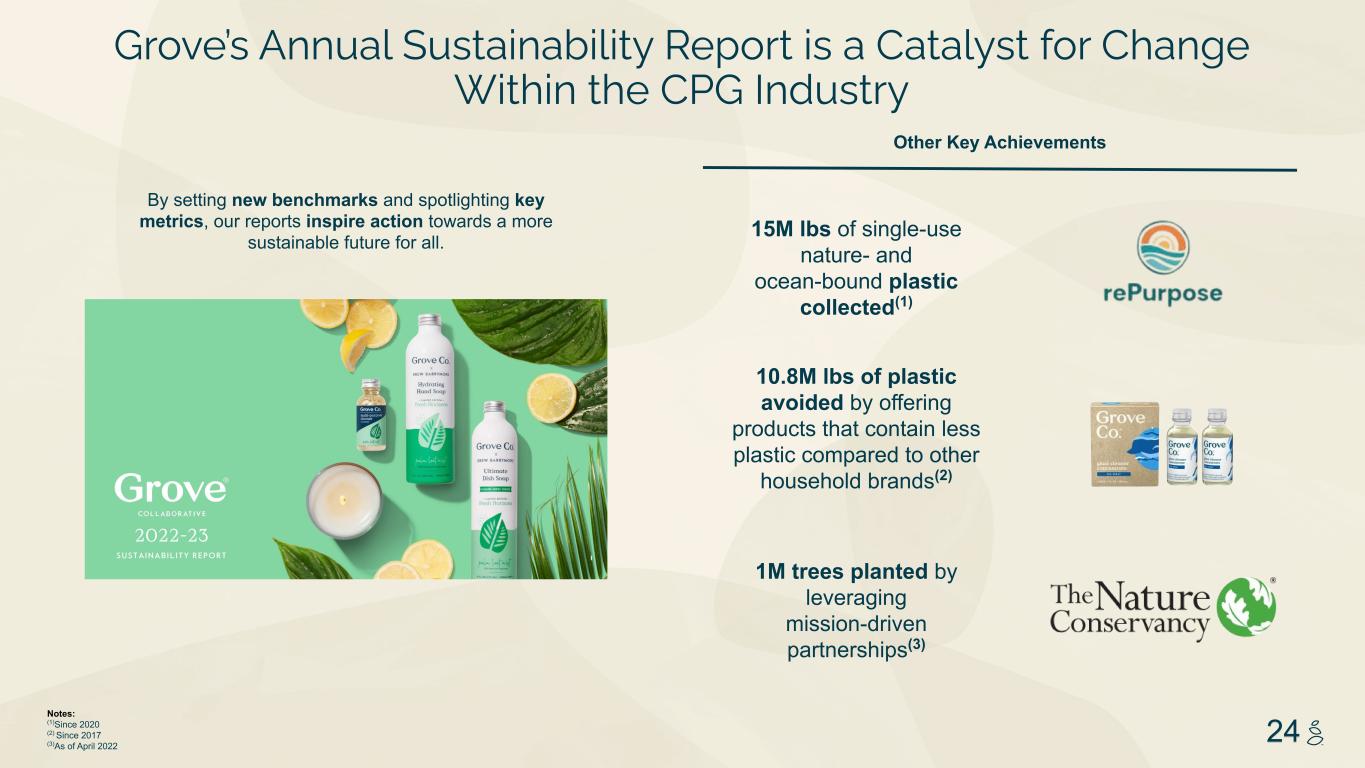
NOTES START FROM HERE AND GROW UP NO CONTENT BELOW THIS LINE CONTENT BELOW THIS LINE SUBTITLE BELOW THIS LINE TITLE CAN NOT GO ABOVE THIS LINE 3 59 76 0 114 88 120 159 144 130 186 128 102 163 157 172 196 200 255 255 255 0 0 0 247 243 228 3 59 76 247 243 228 24 Notes: (1)Since 2020 (2) Since 2017 (3)As of April 2022 15M lbs of single-use nature- and ocean-bound plastic collected(1) 10.8M lbs of plastic avoided by offering products that contain less plastic compared to other household brands(2) 1M trees planted by leveraging mission-driven partnerships(3) Other Key Achievements By setting new benchmarks and spotlighting key metrics, our reports inspire action towards a more sustainable future for all. Grove’s Annual Sustainability Report is a Catalyst for Change Within the CPG Industry

NOTES START FROM HERE AND GROW UP NO CONTENT BELOW THIS LINE CONTENT BELOW THIS LINE SUBTITLE BELOW THIS LINE TITLE CAN NOT GO ABOVE THIS LINE 3 59 76 0 114 88 120 159 144 130 186 128 102 163 157 172 196 200 255 255 255 0 0 0 247 243 228 3 59 76 247 243 228 25 Financials
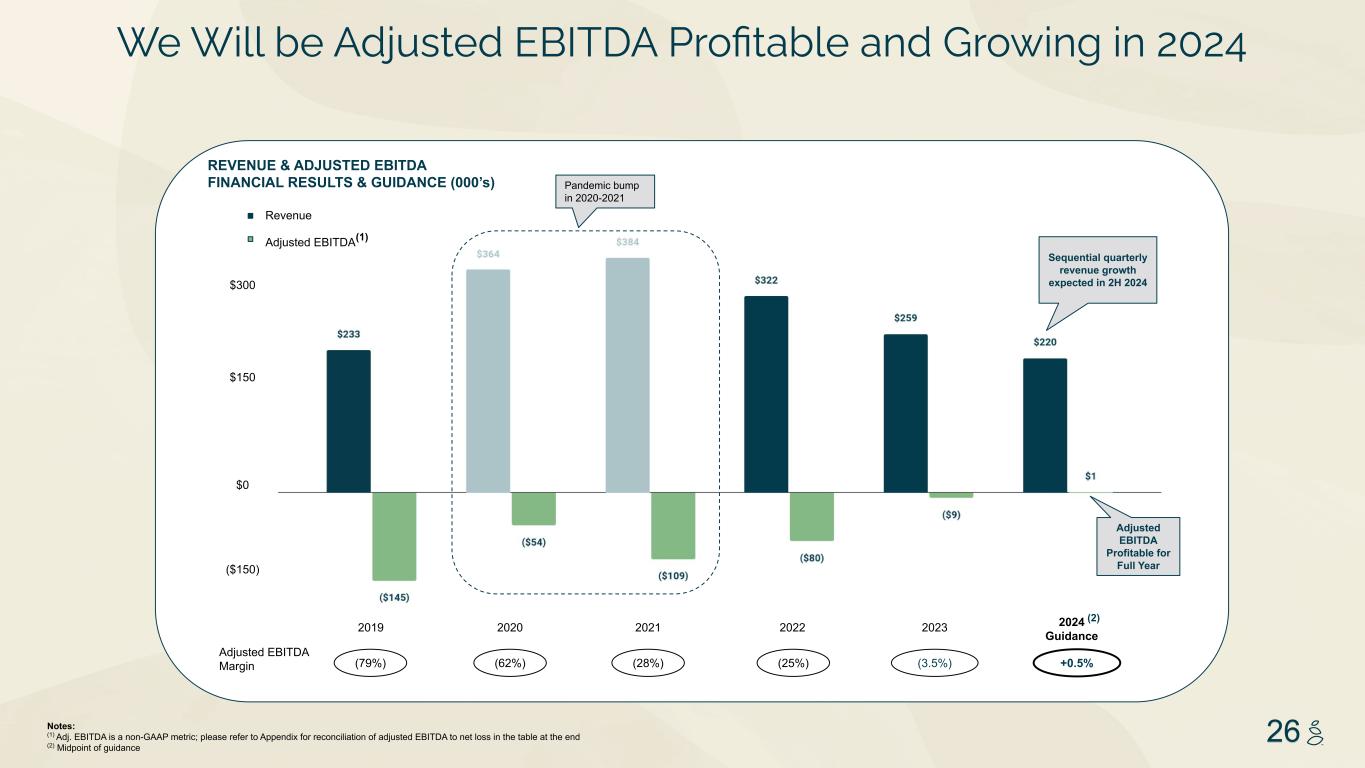
NOTES START FROM HERE AND GROW UP NO CONTENT BELOW THIS LINE CONTENT BELOW THIS LINE SUBTITLE BELOW THIS LINE TITLE CAN NOT GO ABOVE THIS LINE 3 59 76 0 114 88 120 159 144 130 186 128 102 163 157 172 196 200 255 255 255 0 0 0 247 243 228 3 59 76 247 243 228 26Notes: (1) Adj. EBITDA is a non-GAAP metric; please refer to Appendix for reconciliation of adjusted EBITDA to net loss in the table at the end (2) Midpoint of guidance Revenue Adjusted EBITDA(1) Sequential quarterly revenue growth expected in 2H 2024 REVENUE & ADJUSTED EBITDA FINANCIAL RESULTS & GUIDANCE (000’s) Pandemic bump in 2020-2021 $300 $150 $0 ($150) Adjusted EBITDA Profitable for Full Year 2019 2020 2022 (79%) Adjusted EBITDA Margin (62%) (28%) 2023 (3.5%) 2024 Guidance +0.5% (2) 2021 (25%) We Will be Adjusted EBITDA Profitable and Growing in 2024
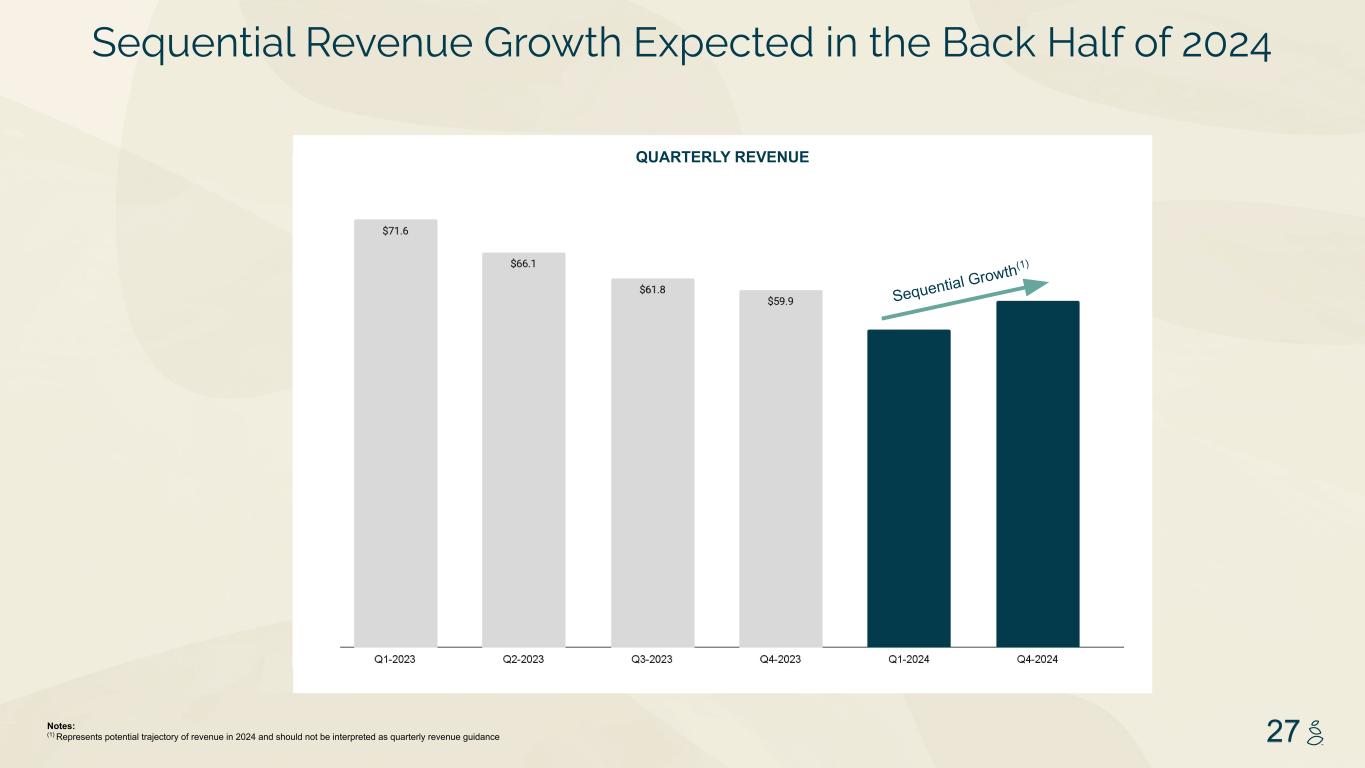
NOTES START FROM HERE AND GROW UP NO CONTENT BELOW THIS LINE CONTENT BELOW THIS LINE SUBTITLE BELOW THIS LINE TITLE CAN NOT GO ABOVE THIS LINE 3 59 76 0 114 88 120 159 144 130 186 128 102 163 157 172 196 200 255 255 255 0 0 0 247 243 228 3 59 76 247 243 228 27 Sequential Growth(1) Sequential Revenue Growth Expected in the Back Half of 2024 QUARTERLY REVENUE Notes: (1) Represents potential trajectory of revenue in 2024 and should not be interpreted as quarterly revenue guidance
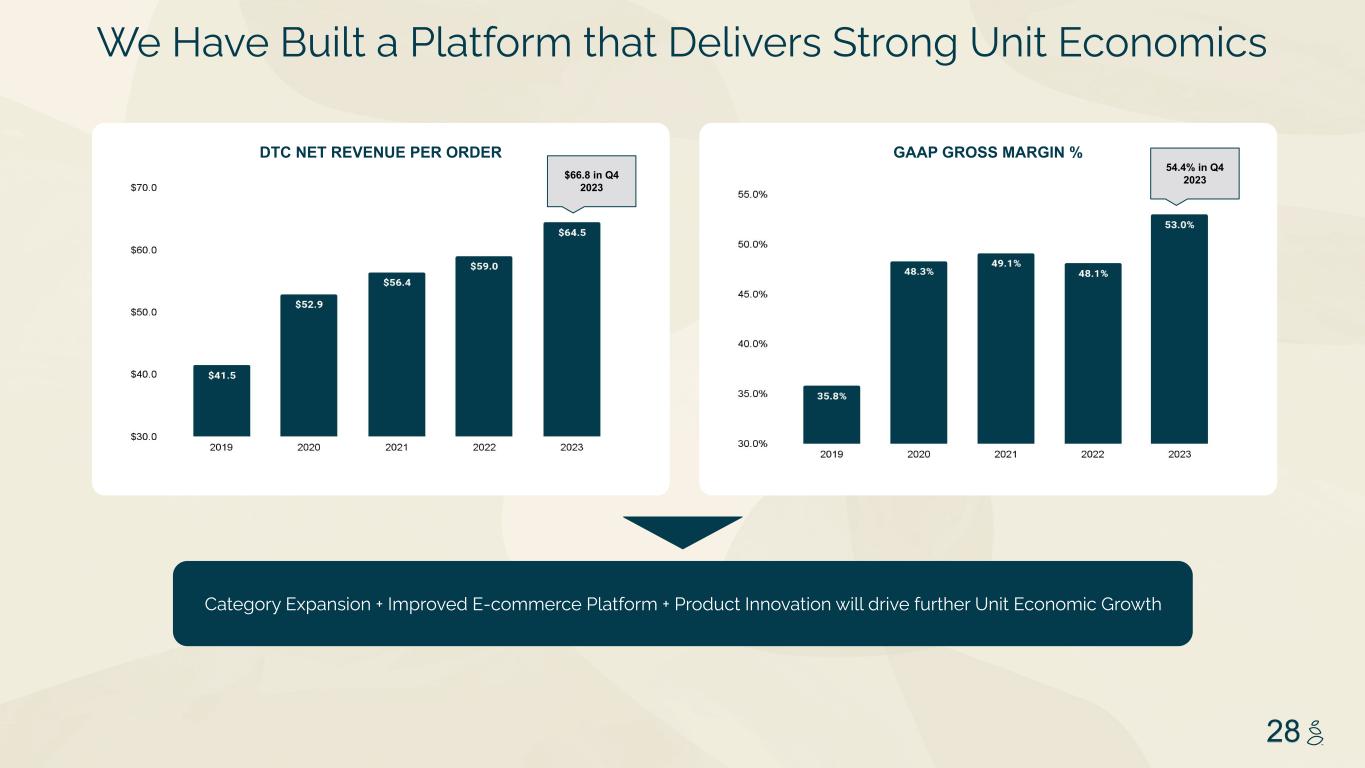
NOTES START FROM HERE AND GROW UP NO CONTENT BELOW THIS LINE CONTENT BELOW THIS LINE SUBTITLE BELOW THIS LINE TITLE CAN NOT GO ABOVE THIS LINE 3 59 76 0 114 88 120 159 144 130 186 128 102 163 157 172 196 200 255 255 255 0 0 0 247 243 228 3 59 76 247 243 228 28 GAAP GROSS MARGIN % Category Expansion + Improved E-commerce Platform + Product Innovation will drive further Unit Economic Growth DTC NET REVENUE PER ORDER We Have Built a Platform that Delivers Strong Unit Economics $66.8 in Q4 2023 54.4% in Q4 2023
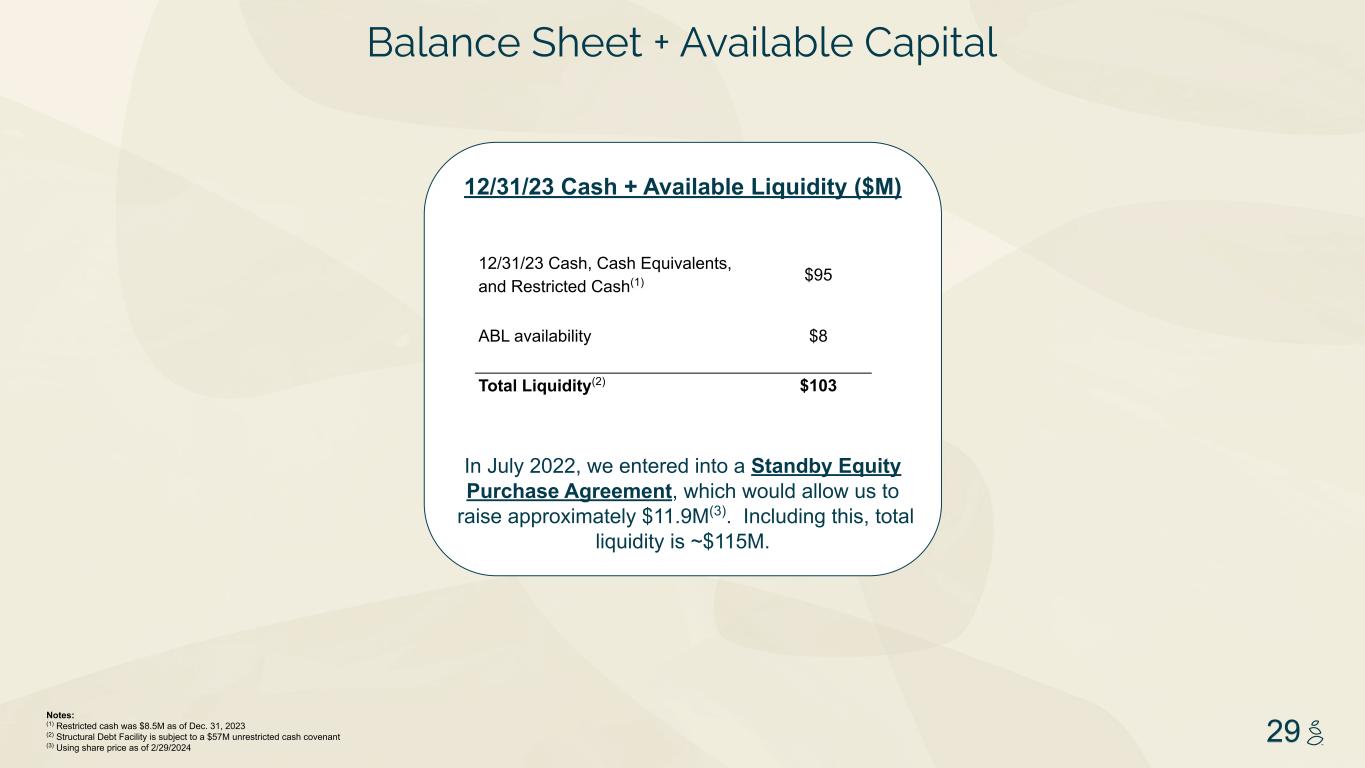
NOTES START FROM HERE AND GROW UP NO CONTENT BELOW THIS LINE CONTENT BELOW THIS LINE SUBTITLE BELOW THIS LINE TITLE CAN NOT GO ABOVE THIS LINE 3 59 76 0 114 88 120 159 144 130 186 128 102 163 157 172 196 200 255 255 255 0 0 0 247 243 228 3 59 76 247 243 228 29 12/31/23 Cash + Available Liquidity ($M) In July 2022, we entered into a Standby Equity Purchase Agreement, which would allow us to raise approximately $11.9M(3). Including this, total liquidity is ~$115M. 12/31/23 Cash, Cash Equivalents, and Restricted Cash(1) $95 ABL availability $8 Total Liquidity(2) $103 Notes: (1) Restricted cash was $8.5M as of Dec. 31, 2023 (2) Structural Debt Facility is subject to a $57M unrestricted cash covenant (3) Using share price as of 2/29/2024 Balance Sheet + Available Capital
NOTES START FROM HERE AND GROW UP NO CONTENT BELOW THIS LINE CONTENT BELOW THIS LINE SUBTITLE BELOW THIS LINE TITLE CAN NOT GO ABOVE THIS LINE 3 59 76 0 114 88 120 159 144 130 186 128 102 163 157 172 196 200 255 255 255 0 0 0 247 243 228 3 59 76 247 243 228 30CONFIDENTIAL Supplemental Materials
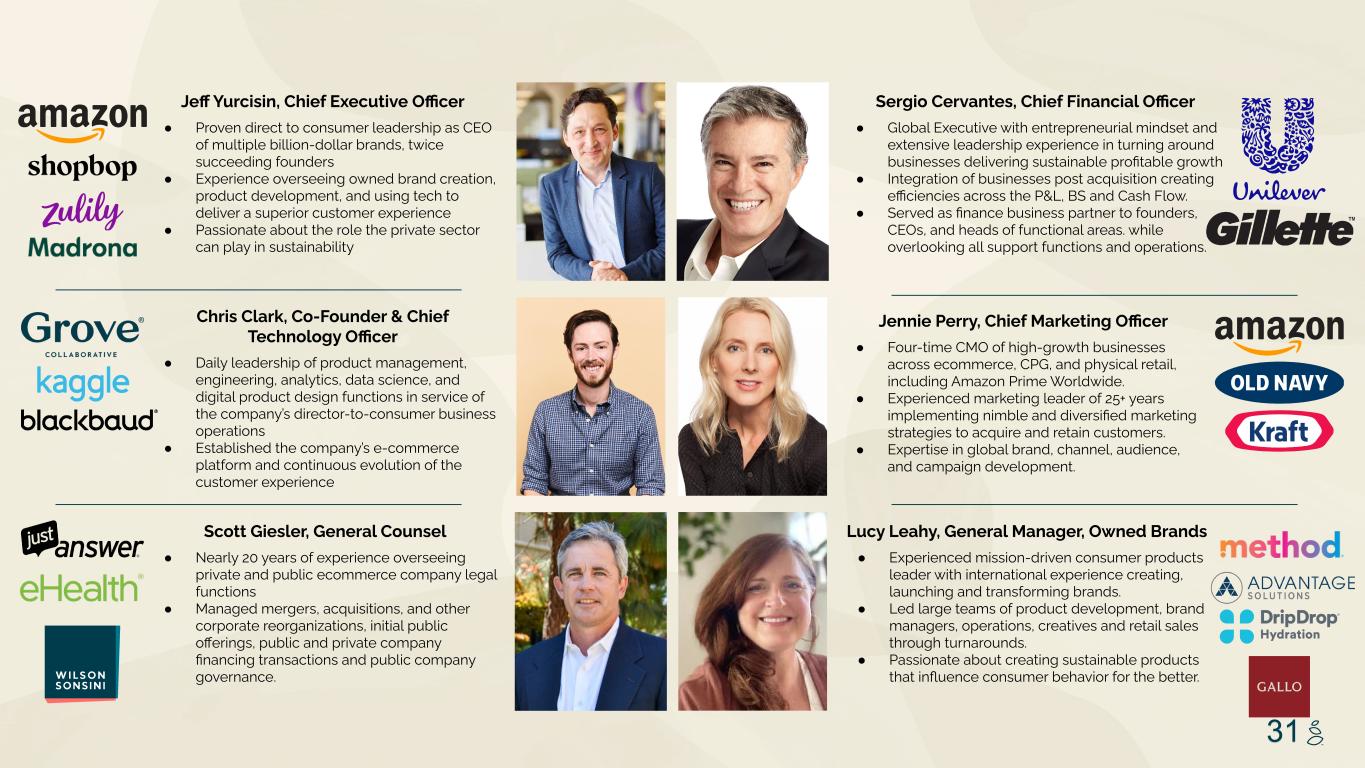
NOTES START FROM HERE AND GROW UP NO CONTENT BELOW THIS LINE CONTENT BELOW THIS LINE SUBTITLE BELOW THIS LINE TITLE CAN NOT GO ABOVE THIS LINE 3 59 76 0 114 88 120 159 144 130 186 128 102 163 157 172 196 200 255 255 255 0 0 0 247 243 228 3 59 76 247 243 228 31 Jeff Yurcisin, Chief Executive Officer ● Proven direct to consumer leadership as CEO of multiple billion-dollar brands, twice succeeding founders ● Experience overseeing owned brand creation, product development, and using tech to deliver a superior customer experience ● Passionate about the role the private sector can play in sustainability Sergio Cervantes, Chief Financial Officer ● Global Executive with entrepreneurial mindset and extensive leadership experience in turning around businesses delivering sustainable profitable growth ● Integration of businesses post acquisition creating efficiencies across the P&L, BS and Cash Flow. ● Served as finance business partner to founders, CEOs, and heads of functional areas. while overlooking all support functions and operations. Chris Clark, Co-Founder & Chief Technology Officer ● Daily leadership of product management, engineering, analytics, data science, and digital product design functions in service of the company’s director-to-consumer business operations ● Established the company’s e-commerce platform and continuous evolution of the customer experience Scott Giesler, General Counsel ● Nearly 20 years of experience overseeing private and public ecommerce company legal functions ● Managed mergers, acquisitions, and other corporate reorganizations, initial public offerings, public and private company financing transactions and public company governance. Jennie Perry, Chief Marketing Officer ● Four-time CMO of high-growth businesses across ecommerce, CPG, and physical retail, including Amazon Prime Worldwide. ● Experienced marketing leader of 25+ years implementing nimble and diversified marketing strategies to acquire and retain customers. ● Expertise in global brand, channel, audience, and campaign development. Lucy Leahy, General Manager, Owned Brands ● Experienced mission-driven consumer products leader with international experience creating, launching and transforming brands. ● Led large teams of product development, brand managers, operations, creatives and retail sales through turnarounds. ● Passionate about creating sustainable products that influence consumer behavior for the better.
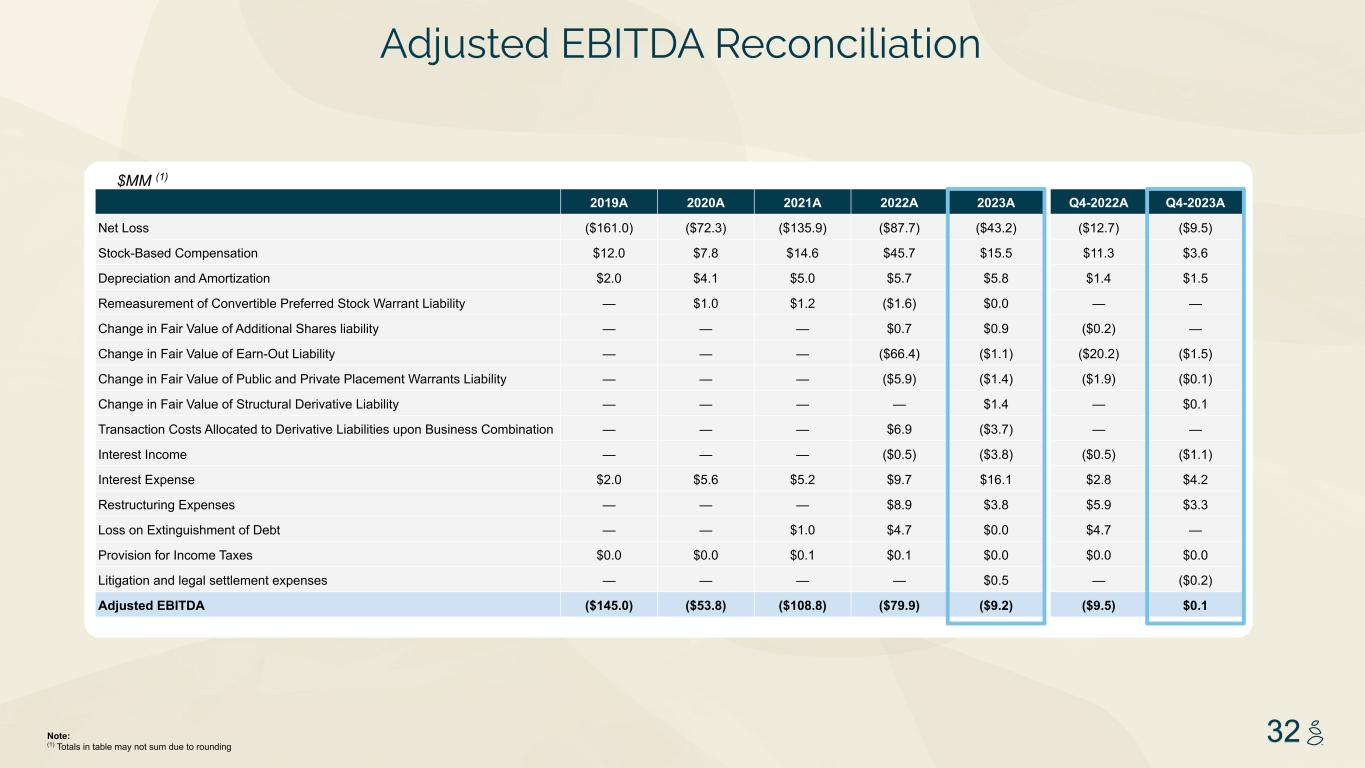
NOTES START FROM HERE AND GROW UP NO CONTENT BELOW THIS LINE CONTENT BELOW THIS LINE SUBTITLE BELOW THIS LINE TITLE CAN NOT GO ABOVE THIS LINE 3 59 76 0 114 88 120 159 144 130 186 128 102 163 157 172 196 200 255 255 255 0 0 0 247 243 228 3 59 76 247 243 228 32 2019A 2020A 2021A 2022A 2023A Q4-2022A Q4-2023A Net Loss ($161.0) ($72.3) ($135.9) ($87.7) ($43.2) ($12.7) ($9.5) Stock-Based Compensation $12.0 $7.8 $14.6 $45.7 $15.5 $11.3 $3.6 Depreciation and Amortization $2.0 $4.1 $5.0 $5.7 $5.8 $1.4 $1.5 Remeasurement of Convertible Preferred Stock Warrant Liability — $1.0 $1.2 ($1.6) $0.0 — — Change in Fair Value of Additional Shares liability — — — $0.7 $0.9 ($0.2) — Change in Fair Value of Earn-Out Liability — — — ($66.4) ($1.1) ($20.2) ($1.5) Change in Fair Value of Public and Private Placement Warrants Liability — — — ($5.9) ($1.4) ($1.9) ($0.1) Change in Fair Value of Structural Derivative Liability — — — — $1.4 — $0.1 Transaction Costs Allocated to Derivative Liabilities upon Business Combination — — — $6.9 ($3.7) — — Interest Income — — — ($0.5) ($3.8) ($0.5) ($1.1) Interest Expense $2.0 $5.6 $5.2 $9.7 $16.1 $2.8 $4.2 Restructuring Expenses — — — $8.9 $3.8 $5.9 $3.3 Loss on Extinguishment of Debt — — $1.0 $4.7 $0.0 $4.7 — Provision for Income Taxes $0.0 $0.0 $0.1 $0.1 $0.0 $0.0 $0.0 Litigation and legal settlement expenses — — — — $0.5 — ($0.2) Adjusted EBITDA ($145.0) ($53.8) ($108.8) ($79.9) ($9.2) ($9.5) $0.1 Adjusted EBITDA Reconciliation $MM (1) Note: (1) Totals in table may not sum due to rounding
NOTES START FROM HERE AND GROW UP NO CONTENT BELOW THIS LINE CONTENT BELOW THIS LINE SUBTITLE BELOW THIS LINE TITLE CAN NOT GO ABOVE THIS LINE 3 59 76 0 114 88 120 159 144 130 186 128 102 163 157 172 196 200 255 255 255 0 0 0 247 243 228 3 59 76 247 243 228 33