Delaware |
5961 |
88-2840659 | ||
(State or Other Jurisdiction of Incorporation or Organization) |
(Primary Standard Industrial Classification Code Number) |
(I.R.S. Employer Identification No.) |
Large accelerated filer |
☐ |
Accelerated filer |
☐ | |||
Non-accelerated filer |
☒ |
Smaller reporting company |
☒ | |||
Emerging growth company |
☒ |
Page |
||||
v |
||||
1 |
||||
8 |
||||
45 |
||||
50 |
||||
51 |
||||
52 |
||||
77 |
||||
100 |
||||
105 |
||||
110 |
||||
116 |
||||
121 |
||||
123 |
||||
137 |
||||
138 |
||||
141 |
||||
142 |
||||
143 |
||||
144 |
||||
F-1 |
• |
competition and the ability of the business to grow and manage growth profitably; |
• |
expansion plans and opportunities, including future acquisitions or additional business combinations; |
• |
litigation, complaints, and/or adverse publicity; |
• |
the impact of changes in consumer spending patterns, consumer preferences, local, regional and national economic conditions, crime, weather, demographic trends, and employee availability; |
• |
privacy and data protection laws, privacy or data breaches, or the loss of data; |
• |
our financial and business performance following the Merger, including financial projections and business metrics; |
• |
changes in the market for the Company’s products, and expansion plans and opportunities; |
• |
anticipated customer retention by the Company; |
• |
the extent to which the Company is able to protect its intellectual property rights and not infringe on the intellectual property rights of others; |
• |
new or adverse regulatory developments relating to automatic renewal laws; |
• |
our use of proceeds from the sale of shares pursuant to the Purchase Agreement; and |
• |
the effect of COVID-19 on the foregoing, including its effect on the business and financial conditions of the Company. |
• | Our significant growth may not be indicative of our future growth and, if we continue to grow rapidly, we may not be able to effectively manage our growth or evaluate our future prospects. If we fail to effectively manage our future growth, our business could be adversely affected. |
• | We have incurred significant losses since inception, we expect to incur losses in the future, and we may not be able to generate sufficient revenue to achieve and maintain profitability. |
• | Grove’s independent registered public accounting firm has expressed substantial doubt about Grove’s ability to continue as a going concern, and if we are unable to generate significant revenue or secure additional financing, we may be unable to implement our business plan and grow our business. |
• | We will require additional financing to achieve our goals, and a failure to obtain this necessary capital when needed could force us to delay, limit, reduce our investments in advertising and other strategic initiatives planned for future growth. |
• | Competition in the natural and sustainable consumer products market presents an ongoing threat to the success of our business. |
• | We must find sustainable solutions that support our brand and long-term growth. |
• | If we fail to cost-effectively acquire new consumers or retain our existing consumers, our business could be adversely affected. |
• | Our brand and reputation may be diminished due to real or perceived quality, safety, efficacy or environmental impact issues with our products, which could have an adverse effect on our business, financial condition, results of operations and prospects. |
• | Failure to introduce new products that meet the expectations of our customers may adversely affect our ability to continue to grow. |
• | We pursue acquisitions to expand our business, and if any of those acquisitions are unsuccessful, our business may be harmed. |
• | We are dependent on our management team, and the loss of one or more key employees or groups could harm our business and prevent us from implementing our business plan in a timely manner. |
• | If we cannot successfully manage the unique challenges presented by international markets, we may not be successful in expanding our operations outside of the United States. |
• | Our business, including our costs and supply chain, is subject to risks associated with sourcing, manufacturing, warehousing, distribution, infrastructure and logistics to third-party providers, and the loss of any of our key suppliers or logistical service providers could negatively impact our business. |
• | If we or our distribution partners do not successfully optimize, operate and manage the expansion of the capacity of our warehouse fulfillment centers, our business, financial condition, results of operations and prospects could be adversely affected. |
• | Risks associated with the outsourcing of our fulfillment process and other technology-related functions could materially and adversely affect our business, financial condition, and results of operations. |
• | We have only recently expanded to offer our own branded products in retail stores and our inability to secure, maintain and increase our presence in retail stores could adversely impact our revenue. |
• | We may be unable to adequately obtain, maintain, protect, defend and enforce our intellectual property rights. |
• | We rely on trademark, copyright, and patent law, trade secret protection, and confidentiality and/or license agreements with our employees, customers, and others to protect our proprietary rights. |
• | Indemnity provisions in various agreements to which we are party potentially expose us to substantial liability for infringement, misappropriation or other violation of intellectual property rights. |
• | If we (or our vendors) are unable to protect against or adequately respond to mitigate the impacts of a service interruption, data corruption, or cybersecurity attack, our operations could be disrupted, our reputation may be harmed and we could face significant costs to remediate the incident and defend against claims by business partners, customers, or regulators. Such security breaches or other cybersecurity incidents may harm our reputation and expose us to loss of consumers and business. |
• | The actual or perceived failure by us or our vendors to comply with applicable privacy and data protection laws, regulations or industry standards could have an adverse effect on our business, financial condition, results of operations and prospects. |
• | Advertising inaccuracies or product mislabeling may have an adverse effect on our business by exposing us to lawsuits, product recalls or regulatory enforcement actions, increasing our operating costs and reducing demand for our product offerings. |
• | We may become subject to product liability claims, which could harm our reputation, financial condition, and liquidity if Grove is not able to successfully defend or insure against such claims. |
• | It is not possible to predict the actual number of shares we will sell under the Purchase Agreement to the Selling Holder, or the actual gross proceeds resulting from those sales. |
• | The sale and issuance of our Class A Common Stock to the Selling Holder will cause dilution to our existing stockholders, and the sale of the shares of Class A Common Stock acquired by the Selling Holder, or the perception that such sales may occur, could cause the price of our Class A Common Stock to fall. |
• | Investors who buy shares of Class A Common Stock at different times will likely pay different prices. |
• | Our management team will have broad discretion over the use of the net proceeds from our sale of shares of Class A Common Stock to the Selling Holder. |
• | The price of Class A Common Stock and our warrants may be volatile. |
• | Warrants will become exercisable for Class A Common Stock, which would increase the number of shares eligible for future resale in the public market and result in dilution to our stockholders. |
• | The Public Warrants may never be in the money, and they may expire worthless and the terms of the warrants may be amended in a manner adverse to a holder if holders of at least 50% of the then-outstanding Public Warrants approve of such amendment. |
• | We may redeem your unexpired warrants prior to their exercise at a time that is disadvantageous to you, thereby making your warrants worthless. |
• | Our dual-class structure may impact the stock price of Class A Common Stock. |
Issuer |
Grove Collaborative Holdings, Inc. |
Shares of Class A Common Stock Offered by the Selling Holder |
Up to 32,544,366 shares of Class A Common Stock that we may elect, in our discretion, to issue and sell to the Selling Holder under the Purchase Agreement from time to time. |
Terms of the Offering |
The Selling Holder will determine when and how it will dispose of any shares of Class A Common Stock registered under this prospectus for resale. |
Class A Common Stock Outstanding After this Offering |
73,785,722 shares of Class A Common Stock. |
Use of Proceeds |
We will not receive any proceeds from the resale of shares of Class A Common Stock included in this prospectus by the Selling Holder. However, we may receive up to $100,000,000 in aggregate gross proceeds, before deducting any discount to the Selling Holder or expenses payable by us, under the Purchase Agreement from sales of Class A Common Stock that we may elect to make to the Selling Holder pursuant to the Purchase Agreement, if any, from time to time in our discretion. |
We expect to use the net proceeds that we receive under the Purchase Agreement for working capital and general corporate purposes, which may include capital expenditures, potential acquisitions, growth opportunities, strategic transactions, and stock repurchases. However, we have not designated any specific uses and have no current agreement with respect to any acquisition or strategic transaction. See “Use of Proceeds.” |
Risk Factors |
See “Risk Factors” and other information included in this prospectus for a discussion of factors you should consider before investing in our securities. |
Trading Symbol |
Our Class A Common Stock is listed and traded on the NYSE under the symbol “GROV.” |
• | 121,561,877 shares of outstanding Class B Common Stock; |
• | 4,517,208 shares of Class A Common Stock issuable upon the settlement of restricted stock units (“RSUs”) granted under the 2016 Equity Incentive Plan (the “2016 Plan”); |
• | 1,184,158 shares of Class B Common Stock issuable upon the settlement of RSUs granted under the 2016 Plan; |
• | 9,323,547 shares of Class A Common Stock issuable upon the exercise of outstanding stock options granted under the 2016 Plan; |
• | 15,312,140 shares of Class B Common Stock issuable upon the exercise of outstanding stock options granted under the 2016 Plan; |
• | 24,523,328 shares of Class A Common Stock available for future issuance under the 2022 Equity and Incentive Plan; |
• | 3,274,070 shares of Class A Common Stock available for future issuance under the 2022 Employee Stock Purchase Plan; |
• | 6,700,000 shares issuable upon the exercise of outstanding private warrants to purchase Class A Common Stock (the “Private Placement Warrants”); |
• | 8,050,000 shares issuable upon the exercise of outstanding public warrants to purchase Class A Common Stock, (the “Public Warrants,”) with an exercise price of $11.50 per share; |
• | 923,857 shares issuable upon the exercise of outstanding warrants to purchase Class B Common Stock (the “Legacy Grove Warrants”); and |
• | 3,875,028 shares issuable upon the exercise of outstanding warrants to purchase Class A Common Stock pursuant to the Backstop Subscription Agreement (the “Backstop Warrants”). |
• | The FDA regulates product labels and other product claims for the consumer products subject to its jurisdiction and has the authority to challenge product labels and claims that it believes are non-compliant or false or misleading, through the use of a variety of enforcement tools (e.g., Warning Letters, untitled letters, and seizure actions). In limited circumstances, the FDA has taken regulatory action against products labeled “natural” but that nonetheless contain synthetic ingredients or components. |
• | The FTC has the authority to challenge claims made in product advertising and requires that such claims are adequately substantiated prior to use. The FTC similarly has enforcement tools that it uses to challenge advertising claims that it deems non-compliant with the law. |
• | The USDA enforces federal standards for organic production and use of the term “organic” on product labeling. These laws prohibit a company from selling or labeling products as organic unless they are produced and handled in accordance with the applicable federal law. Failure to comply with these requirements may subject us to liability or regulatory enforcement. Consumers may also pursue state law claims challenging use of the organic label as being intentionally mislabeled or misleading or deceptive to consumers. |
• | In addition, certain products, including the disinfectant products, we sell may require approval from and registration with the EPA and state regulatory agencies prior to sale. Products that expressly or impliedly claim to control microorganisms that pose a threat to human health may be subject by additional regulatory scrutiny and need to be supported by additional efficacy data. Should we advertise or market these regulated products with claims that are not permitted by the terms of their registration or are otherwise false or misleading, the EPA and states may be authorized to take enforcement action to prevent the sale or distribution of disinfectant products. |
• | changes in the industries in which we and our customers operate; |
• | variations in our operating performance and the performance of our competitors in general; |
• | material and adverse impact of the COVID-19 pandemic on the markets and the broader global economy; |
• | actual or anticipated fluctuations in our quarterly or annual results of operation; |
• | publication of research reports by securities analysts about us or our competitors or our industry; |
• | the public’s reaction to our press releases, our other public announcements, and our filings with the SEC; |
• | our failure or the failure of our competitors to meet analysts’ projections or guidance that we or our competitors may give to the market; |
• | additions and departures of key personnel; |
• | changes in laws and regulations affecting our business; |
• | commencement of, or involvement in, litigation involving us; |
• | changes in our capital structure, such as future issuances of securities or the incurrence of additional debt; |
• | the volume of shares of Class A Common Stock available for public sale; |
• | sales of shares of Class A Common Stock by the PIPE Investors; and |
• | general economic and political conditions such as recessions, interest rates, fuel prices and general inflationary pressures, foreign currency fluctuations, international tariffs, social, political, and economic risks, and acts of war or terrorism. |
• | a limited availability of market quotations for our securities; |
• | reduced liquidity for our securities; |
• | a determination that our Class A Common Stock is a “penny stock” which will require brokers trading in our Class A Common Stock to adhere to more stringent rules and possibly result in a reduced level of trading activity in the secondary trading market for our securities; |
• | a limited amount of news and analyst coverage; and |
• | a decreased ability to issue additional securities or obtain additional financing in the future. |
• | a classified board of directors; |
• | the dual-class structure that provides for Class B Common Stock being entitled to ten votes per share; |
• | the ability of the Board to issue shares of preferred stock, including “blank check” preferred stock and to determine the price and other terms of those shares, including preferences and voting rights, without stockholder approval, which could be used to significantly dilute the ownership of a hostile acquirer; |
• | the limitation of the liability of, and the indemnification of, our directors and officers; |
• | the requirement that a special meeting of stockholders may only be called by a majority of the entire Board, the Chairman of the Board, or our Chief Executive Officer, which could delay the ability of stockholders to force consideration of a proposal or to take action, including the removal of directors; |
• | controlling the procedures for the conduct and scheduling of Board and stockholder meetings; |
• | the ability of the Board to amend the Bylaws, which may allow the Board to take additional actions to prevent an unsolicited takeover and inhibit the ability of an acquirer to amend the Bylaws to facilitate an unsolicited takeover attempt; and |
• | advance notice procedures with which stockholders must comply to nominate candidates to the Board or to propose matters to be acted upon at a stockholders’ meeting, which could preclude stockholders from bringing matters before annual or special meetings of stockholders and delay changes in the Board, and also may discourage or deter a potential acquirer from conducting a solicitation of proxies to elect the acquirer’s own slate of directors or otherwise attempting to obtain control of us. |
• | the accuracy in all material respects of our representations and warranties included in the Purchase Agreement; |
• | there being an effective registration statement pursuant to which the Selling Holder is permitted to utilize the prospectus thereunder to resell all of the Advance Shares pursuant to such Advance Notice; |
• | the sale and issuance of such Advance Shares being legally permitted by all laws and regulations to which we are subject; |
• | no Material Outside Event (as such term is defined in the Purchase Agreement) shall have occurred and be continuing; |
• | us having performed, satisfied, and complied in all material respects with all covenants, agreements, and conditions required by the Purchase Agreement to be performed, satisfied, or complied with by us; |
• | no statute, rule, regulation, executive order, decree, ruling, or injunction having been enacted, entered, promulgated, or endorsed by any court or governmental authority of competent jurisdiction that prohibits or directly, materially, and adversely affects any of the transactions contemplated by the Purchaser Agreement; and |
• | the Class A Common Stock being quoted for trading on the NYSE and us having not received any written notice that is then still pending threatening the continued quotation of the Class A Common Stock on the NYSE. |
• | the first day of the month next following the 36-month anniversary of the date of the Purchase Agreement; and |
• | the date on which the Selling Holder shall have purchased shares of Class A Common Stock under the Purchase Agreement for an aggregate gross purchase price equal to $100,000,000. |
Assumed Average Purchase Price Per Share |
Number of Registered Shares to be Issued if Full Purchase(1) |
Percentage of Outstanding Shares After Giving Effect to the Issuance to the Selling Holder(2) |
Gross Proceeds from the Sale of Shares to the Selling Holder Under the Purchase Agreement |
|||||
$2.00 |
50,000,000 | 23.5% | $100,000,000 | |||||
$3.00 |
33,333,333 | 17.0% | $ 99,999,999 | |||||
$4.00 |
25,000,000 | 13.3% | $100,000,000 | |||||
$4.42(3) |
22,624,434 | 12.2% | $ 99,999,998 | |||||
$4.92(4) |
20,325,203 | 11.1% | $ 99,999,998 | |||||
$5.00 |
20,000,000 | 10.9% | $100,000,000 |
(1) | The number of shares of Class A Common Stock offered by this prospectus may not cover all the shares we ultimately sell to the Selling Holder under the Purchase Agreement, depending on the purchase price per share. We have included in this column only those shares being offered for resale by the Selling Holder under this prospectus, without regard for the Beneficial Ownership Limitation. The assumed average |
purchase prices are solely for illustration and are not intended to be estimates or predictions of future stock performance. |
(2) | The denominator is based on 162,803,233 shares outstanding as of June 30, 2022, adjusted to include the issuance of the number of shares set forth in the second column that we would have sold to the Selling Holder, assuming the average purchase price in the first column. The numerator is based on the number of shares of Class A Common Stock set forth in the second column. |
(3) | Represents the closing price of the Class A Common Stock on the NYSE on July 11, 2022, five trading days prior to the execution of the Purchase Agreement and filing of the registration statement of which this prospectus forms a part. |
(4) | Represents the closing price of the Class A Common Stock on the NYSE on July 15, 2022, the trading day prior to the execution of the Purchase Agreement and filing of the registration statement of which this prospectus forms a part. |
Years Ended December 31, |
Three Months Ended March 31, |
|||||||||||||||||||
2019 |
2020 |
2021 |
2021 |
2022 |
||||||||||||||||
Financial and Operating Data |
||||||||||||||||||||
Grove Brands % Net Revenue |
37 | % | 45 | % | 49 | % | 51 | % | 52 | % | ||||||||||
DTC Total Orders |
5,618 | 6,860 | 6,659 | 1,786 | 1,558 | |||||||||||||||
DTC Active Customers |
1,696 | 1,732 | 1,640 | 1,774 | 1,653 | |||||||||||||||
DTC Net Revenue Per Order |
$ | 41 | $ | 53 | $ | 56 | $ | 56 | $ | 55 |
Year Ended December 31, |
Three Months Ended March 31, |
|||||||||||||||||||
2019 |
2020 |
2021 |
2021 |
2022 |
||||||||||||||||
Reconciliation of Net Loss to Adjusted EBITDA |
(in thousands) |
|||||||||||||||||||
Net loss |
$ | (161,470 | ) | $ | (72,260 | ) | $ | (135,896 | ) | $ | (37,895 | ) | $ | (47,384 | ) | |||||
Stock-based compensation |
11,960 | 7,762 | 14,610 | 3,460 | 4,460 | |||||||||||||||
Depreciation and amortization |
2,361 | 4,115 | 4,992 | 1,128 | 1,410 | |||||||||||||||
Remeasurement of convertible preferred stock warrant liability |
430 | 964 | 1,234 | 932 | (1,886 | ) | ||||||||||||||
Interest expense |
2,052 | 5,607 | 5,202 | 963 | 2,087 | |||||||||||||||
Restructuring expenses |
— | — | — | — | 1,636 | |||||||||||||||
Loss on extinguishment of debt |
— | — | 1,027 | — | — | |||||||||||||||
Provision for income taxes |
12 | 41 | 52 | 12 | 23 | |||||||||||||||
|
|
|
|
|
|
|
|
|
|
|||||||||||
Total Adjusted EBITDA |
$ | (144,655 | ) | $ | (53,771 | ) | $ | (108,779 | ) | $ | (31,400 | ) | $ | (39,654 | ) | |||||
|
|
|
|
|
|
|
|
|
|
|||||||||||
Net loss margin |
(69 | )% | (20 | )% | (35 | )% | (37.1 | )% | (52.4 | )% | ||||||||||
Adjusted EBITDA margin |
(62 | )% | (15 | )% | (28 | )% | (30.7 | )% | (43.8 | )% |
Year Ended December 31, |
Three Months Ended March 31, |
|||||||||||||||||||
2019 |
2020 |
2021 |
2021 |
2022 |
||||||||||||||||
(in thousands) |
||||||||||||||||||||
Revenue, net |
$ | 233,116 | $ | 364,271 | $ | 383,685 | $ | 102,220 | $ | 90,479 | ||||||||||
Cost of goods sold |
149,681 | 188,267 | 195,181 | 50,028 | 47,742 | |||||||||||||||
|
|
|
|
|
|
|
|
|
|
|||||||||||
Gross profit |
83,435 | 176,004 | 188,504 | 52,192 | 42,737 | |||||||||||||||
|
|
|
|
|
|
|
|
|
|
|||||||||||
Operating expenses: |
||||||||||||||||||||
Advertising |
77,842 | 55,547 | 107,313 | 35,636 | 32,793 | |||||||||||||||
Product development |
13,604 | 18,655 | 23,408 | 5,162 | 6,240 | |||||||||||||||
Selling, general and administrative |
155,158 | 168,295 | 186,638 | 47,538 | 50,970 | |||||||||||||||
|
|
|
|
|
|
|
|
|
|
|||||||||||
Operating loss |
(163,169 | ) | (66,493 | ) | (128,855 | ) | (36,144 | ) | (47,266 | ) | ||||||||||
|
|
|
|
|
|
|
|
|
|
|||||||||||
Interest expense |
2,052 | 5,607 | 5,202 | 963 | 2,087 | |||||||||||||||
Loss on extinguishment of debt |
— | — | 1,027 | — | — | |||||||||||||||
Other expense (income), net |
(3,763 | ) | 119 | 760 | 776 | (1,992 | ) | |||||||||||||
|
|
|
|
|
|
|
|
|
|
|||||||||||
Interest and other expense (income), net |
(1,711 | ) | 5,726 | 6,989 | 1,739 | 95 | ||||||||||||||
|
|
|
|
|
|
|
|
|
|
|||||||||||
Loss before provision for income taxes |
(161,458 | ) | (72,219 | ) | (135,844 | ) | (37,883 | ) | (47,361 | ) | ||||||||||
Provision for income taxes |
12 | 41 | 52 | 12 | 23 | |||||||||||||||
|
|
|
|
|
|
|
|
|
|
|||||||||||
Net loss |
$ | (161,470 | ) | $ | (72,260 | ) | $ | (135,896 | ) | $ | (37,895 | ) | $ | (47,384 | ) | |||||
|
|
|
|
|
|
|
|
|
|
Year Ended December 31, |
Three Months Ended March 31, |
|||||||||||||||||||
2019 |
2020 |
2021 |
2021 |
2022 |
||||||||||||||||
(as a percentage of revenue) |
||||||||||||||||||||
Revenue, net |
100 | % | 100 | % | 100 | % | 100 | % | 100 | % | ||||||||||
Cost of goods sold |
64 | 52 | 51 | 49 | 53 | |||||||||||||||
|
|
|
|
|
|
|
|
|
|
|||||||||||
Gross profit |
36 | 48 | 49 | 51 | 47 | |||||||||||||||
|
|
|
|
|
|
|
|
|
|
|||||||||||
Operating expenses: |
||||||||||||||||||||
Advertising |
33 | 15 | 28 | 35 | 36 | |||||||||||||||
Product development |
6 | 5 | 6 | 5 | 7 | |||||||||||||||
Selling, general and administrative |
67 | 46 | 49 | 47 | 56 | |||||||||||||||
|
|
|
|
|
|
|
|
|
|
|||||||||||
Operating loss |
(70 | ) | (18 | ) | (34 | ) | (35 | ) | (52 | ) | ||||||||||
|
|
|
|
|
|
|
|
|
|
|||||||||||
Interest expense |
1 | 2 | 1 | 1 | 2 | |||||||||||||||
Loss on extinguishment of debt |
— | — | — | — | — | |||||||||||||||
Other expense (income), net |
(2 | ) | — | — | 1 | (2 | ) | |||||||||||||
|
|
|
|
|
|
|
|
|
|
|||||||||||
Interest and other expense (income), net |
(1 | ) | 2 | 1 | 2 | — | ||||||||||||||
|
|
|
|
|
|
|
|
|
|
|||||||||||
Loss before provision for income taxes |
(69 | ) | (20 | ) | (35 | ) | (37 | ) | (52 | ) | ||||||||||
Provision for income taxes |
— | — | — | — | — | |||||||||||||||
|
|
|
|
|
|
|
|
|
|
|||||||||||
Net loss |
(69 | )% | (20 | )% | (35 | )% | (37 | )% | (52 | )% | ||||||||||
|
|
|
|
|
|
|
|
|
|
Three Months Ended March 31, |
Change |
|||||||||||||||
2021 |
2022 |
Amount |
% |
|||||||||||||
(in thousands) |
||||||||||||||||
Revenue, net: |
||||||||||||||||
Grove Brands |
$ | 52,285 | $ | 46,796 | $ | (5,489 | ) | (10 | )% | |||||||
Third-party products |
49,935 | 43,683 | (6,252 | ) | (13 | )% | ||||||||||
|
|
|
|
|
|
|
|
|||||||||
Total revenue, net |
$ | 102,220 | $ | 90,479 | $ | (11,741 | ) | (11 | )% | |||||||
|
|
|
|
|
|
|
|
Three Months Ended March 31, |
Change |
|||||||||||||||
2021 |
2022 |
Amount |
% |
|||||||||||||
(in thousands) |
||||||||||||||||
Cost of goods sold |
$ | 50,028 | $ | 47,742 | $ | (2,286 | ) | (5 | )% | |||||||
Gross profit |
52,192 | 42,737 | (9,455 | ) | (18 | )% | ||||||||||
Gross margin |
51 | % | 47 | % | (4 | )% |
Three Months Ended March 31, |
Change |
|||||||||||||||
2021 |
2022 |
Amount |
% |
|||||||||||||
(in thousands) |
||||||||||||||||
Advertising |
$ | 35,636 | $ | 32,793 | $ | (2,843 | ) | (8 | )% |
Three Months Ended March 31, |
Change |
|||||||||||||||
2021 |
2022 |
Amount |
% |
|||||||||||||
(in thousands) |
||||||||||||||||
Product development |
$ | 5,162 | $ | 6,240 | $ | 1,078 | 21 | % |
Three Months Ended March 31, |
Change |
|||||||||||||||
2021 |
2022 |
Amount |
% |
|||||||||||||
(in thousands) |
||||||||||||||||
Selling, general and administrative |
$ | 47,538 | $ | 50,970 | $ | 3,432 | 7 | % |
Three Months Ended March 31, |
Change |
|||||||||||||||
2021 |
2022 |
Amount |
% |
|||||||||||||
(in thousands) |
||||||||||||||||
Interest expense |
$ | 963 | $ | 2,087 | $ | 1,124 | 117 | % |
Three Months Ended March 31, |
Change |
|||||||||||||||
2021 |
2022 |
Amount |
% |
|||||||||||||
(in thousands) |
||||||||||||||||
Other expense (income), net |
$ | 776 | $ | (1,992 | ) | $ | (2,768 | ) | * |
* | Percentage change not meaningful. |
Year Ended December 31, |
Change |
|||||||||||||||
2020 |
2021 |
Amount |
% |
|||||||||||||
(in thousands) |
||||||||||||||||
Revenue, net: |
||||||||||||||||
Grove Brands |
$ | 164,372 | $ | 187,055 | $ | 22,683 | 14 | % | ||||||||
Third-party products |
199,899 | 196,630 | (3,269 | ) | (2 | )% | ||||||||||
|
|
|
|
|
|
|||||||||||
Total revenue, net |
$ | 364,271 | $ | 383,685 | $ | 19,414 | 5 | % | ||||||||
|
|
|
|
|
|
Year Ended December 31, |
Change |
|||||||||||||||
2020 |
2021 |
Amount |
% |
|||||||||||||
(in thousands) |
||||||||||||||||
Cost of goods sold |
$ | 188,267 | $ | 195,181 | $ | 6,914 | 4 | % | ||||||||
Gross profit |
176,004 | 188,504 | 12,500 | 7 | % | |||||||||||
Gross margin |
48 | % | 49 | % | 1 | % |
Year Ended December 31, |
Change |
|||||||||||||||
2020 |
2021 |
Amount |
% |
|||||||||||||
(in thousands) |
||||||||||||||||
Advertising |
$ | 55,547 | $ | 107,313 | $ | 51,766 | 93 | % |
Year Ended December 31, |
Change |
|||||||||||||||
2020 |
2021 |
Amount |
% |
|||||||||||||
(in thousands) |
||||||||||||||||
Product development |
$ | 18,655 | $ | 23,408 | $ | 4,753 | 25 | % |
Year Ended December 31, |
Change |
|||||||||||||||
2020 |
2021 |
Amount |
% |
|||||||||||||
(in thousands) |
||||||||||||||||
Selling, general and administrative |
$ | 168,295 | $ | 186,638 | $ | 18,343 | 11 | % |
Year Ended December 31, |
Change |
|||||||||||||||
2020 |
2021 |
Amount |
% |
|||||||||||||
(in thousands) |
||||||||||||||||
Interest expense |
$ | 5,607 | $ | 5,202 | $ | (405 | ) | (7 | )% |
Year Ended December 31, |
Change |
|||||||||||||||
2020 |
2021 |
Amount |
% |
|||||||||||||
(in thousands) |
||||||||||||||||
Loss on extinguishment of debt |
$ | — | $ | 1,027 | $ | 1,027 | * |
* | Percentage change not meaningful. |
Year Ended December 31, |
Change |
|||||||||||||||
2020 |
2021 |
Amount |
% |
|||||||||||||
(in thousands) |
||||||||||||||||
Other expense, net |
$ | 119 | $ | 760 | $ | 641 | * |
* | Percentage change not meaningful. |
Year Ended December 31, |
Change |
|||||||||||||||
2019 |
2020 |
Amount |
% |
|||||||||||||
(in thousands) |
||||||||||||||||
Revenue, net: |
||||||||||||||||
Grove Brands |
$ | 86,717 | $ | 164,372 | $ | 77,655 | 90 | % | ||||||||
Third-party products |
146,399 | 199,899 | 53,500 | 37 | % | |||||||||||
|
|
|
|
|
|
|||||||||||
Total revenue, net |
$ | 233,116 | $ | 364,271 | $ | 131,155 | 56 | % | ||||||||
|
|
|
|
|
|
Year Ended December 31, |
Change |
|||||||||||||||
2019 |
2020 |
Amount |
% |
|||||||||||||
(in thousands) |
||||||||||||||||
Cost of goods sold |
$ | 149,681 | $ | 188,267 | $ | 38,586 | 26 | % | ||||||||
Gross profit |
83,435 | 176,004 | 92,569 | 111 | % | |||||||||||
Gross margin |
36 | % | 48 | % | 12 | % |
Year Ended December 31, |
Change |
|||||||||||||||
2019 |
2020 |
Amount |
% |
|||||||||||||
(in thousands) |
||||||||||||||||
Advertising |
$ | 77,842 | $ | 55,547 | $ | (22,295 | ) | (29 | )% |
Year Ended December 31, |
Change |
|||||||||||||||
2019 |
2020 |
Amount |
% |
|||||||||||||
(in thousands) |
||||||||||||||||
Product development |
$ | 13,604 | $ | 18,655 | $ | 5,051 | 37 | % |
Year Ended December 31, |
Change |
|||||||||||||||
2019 |
2020 |
Amount |
% |
|||||||||||||
(in thousands) |
||||||||||||||||
Selling, general and administrative |
$ | 155,158 | $ | 168,295 | $ | 13,137 | 8 | % |
Year Ended December 31, |
Change |
|||||||||||||||
2019 |
2020 |
Amount |
% |
|||||||||||||
(in thousands) |
||||||||||||||||
Interest expense |
$ | 2,052 | $ | 5,607 | $ | 3,555 | 173 | % |
Year Ended December 31, |
Change |
|||||||||||||||
2019 |
2020 |
Amount |
% |
|||||||||||||
(in thousands) |
||||||||||||||||
Other expense (income), net |
$ | (3,763 | ) | $ | 119 | $ | 3,882 | (103 | )% |
Three Months Ended March 31, |
||||||||
2021 |
2022 |
|||||||
(in thousands) |
||||||||
Net cash used in operating activities |
$ | (27,952 | ) | $ | (29,503 | ) | ||
Net cash used in investing activities |
(1,262 | ) | (1,352 | ) | ||||
Net cash provided by (used in) financing activities |
(840 | ) | 26,907 | |||||
|
|
|
|
|||||
Net decrease in cash and cash equivalents |
$ | (30,054 | ) | $ | (3,948 | ) | ||
|
|
|
|
Year Ended December 31, |
||||||||||||
2019 |
2020 |
2021 |
||||||||||
(in thousands) |
||||||||||||
Net cash used in operating activities |
$ | (124,805 | ) | $ | (83,656 | ) | $ | (127,089 | ) | |||
Net cash used in investing activities |
(12,307 | ) | (4,820 | ) | (5,768 | ) | ||||||
Net cash provided by financing activities |
107,447 | 228,170 | 34,710 | |||||||||
|
|
|
|
|
|
|||||||
Net increase (decrease) in cash and cash equivalents |
$ | (29,665 | ) | $ | 139,694 | $ | (98,147 | ) | ||||
|
|
|
|
|
|
• | independent third-party valuations of our common stock; |
• | the rights, preferences and privileges of our redeemable convertible preferred stock relative to our common stock; |
• | our operating results, financial position and capital resources; |
• | our stage of development and current business conditions and projections, including the introduction of new products; |
• | the lack of marketability of our common stock; |
• | the hiring of key personnel and the experience of our management; |
• | the likelihood of achieving a liquidity event, such as an initial public offering or a sale of our company given the prevailing market conditions; |
• | and the nature and history of our business; |
• | industry trends and competitive environment; |
• | trends in consumer spending, including consumer confidence; and |
• | the overall economic, regulatory and capital market conditions. |
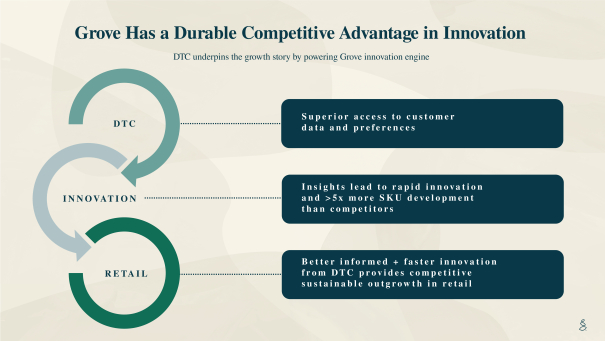
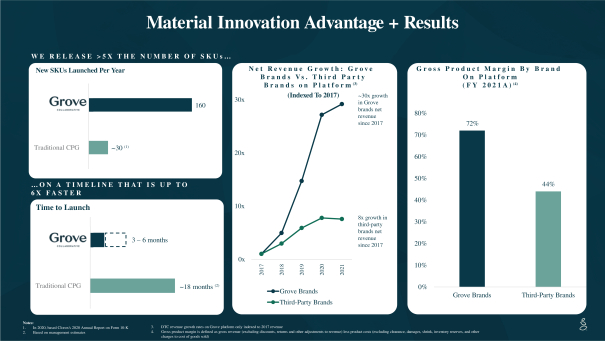
• | We can test market acceptance of product attributes prior to or as part of product launch, including fragrance, price point, marketing messaging, sustainability and more. We can assess market acceptance of products on our DTC platform prior to a product ready date to determine consumer interest via our waitlist feature. |
• | We can quickly gather consumer feedback by including samples in existing shipments, conducting online focus groups, and asking our consumers directly. We can then improve the products where possible and relaunch or drop underperforming SKUs at very little cost. |
• | We can launch products on our DTC platform at any point, without the constraints of retailer shelf reset timelines. |
• | We have a deep understanding of our consumers based on historical purchasing behavior, demographic information, and the ways in which they engage with our community and platform. |
I. |
Plastic single-use plastic packaging. As consumers awaken to the reality of the plastic pollution crisis, they are urgently and increasingly demanding bold new solutions. |
• | Plastic Neutral: |
• | Plastic-Free by the End of 2025: |
II. |
Forests: |
• | One Million Trees: |
• | Tree-Free Paper: ® |
III. |
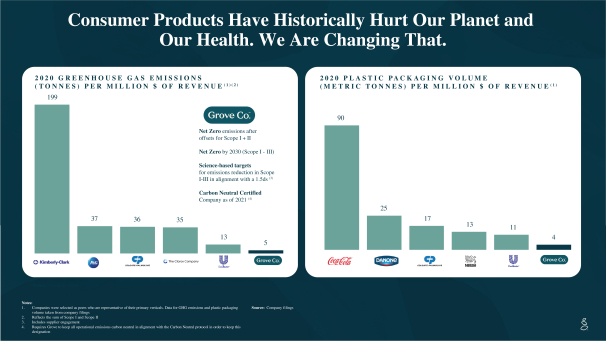
Carbon: |
• | CarbonNeutral ® Certified Company: ® company as of 2021 — meaning that we have purchased carbon offsets to neutralize all of the emissions related to the business activities that are under our direct control, which excludes manufacturing and supply chain. In order to maintain this certification, we are required to continue to reduce or offset the carbon emissions generated by our business activities, consumer shipments and several other areas of our company indicated by the CarbonNeutral® protocol. This codifies our commitment to maintain our values as our business grows. |
• | Net Zero by 2030 1-3 (which include all business activities, product manufacturing and our supply chain). We plan to achieve this through a primary focus on mitigation, with nature-based offsets augmenting the effort. We will disclose our annual progress towards achieving these goals in our annual sustainability report. |
• | Science-Based Targets: With a priority on reducing our emissions as much as possible, we have set Science-Based Targets for emissions reduction across Scopes 1-3. We are currently on track to meet these goals as detailed in our annual sustainability report and will continue to report on that progress. |
• | DTC |
exclusive deals and offers, share newly launched products and display our wide array of seasonal bundles. We offer customers our flexible monthly shipment service to help them stay on top of their home care regimen, as well as non-subscription options. Customers can subscribe to individual products at appropriate cadences to make sure they never run out. We leverage data to further enhance the customer experience by personalizing pages to better fit the customers shopping needs. Our DTC shoppers can reach out to our Grove Guides team for any questions pertaining to their orders. Customers can call, chat, text, or email our Grove Guides team to modify orders, ask about new products, request a refund, or learn more about our sustainability practices. All of our shipments are carbon neutral and all plastic sold is offset through our partnerships with rePurpose Global and Plastic Bank. |
• | Retail brick-and-mortar exclusive-for-Target |
1. | Build a vibrant and engaged online community of consumers who care deeply about both home and planet. In our customer insights surveys, we found that while 61% of consumers self-identify as buying some natural products (across home, personal care, beauty and food), many are unfamiliar with natural and sustainable brands and are only buying products from a small handful of brands, or in one or two categories. They are early on in their journey of switching to natural and sustainable products, and recommendations from friends, family, influencers and other shoppers are especially powerful. On an average day, our community will comment, share or post thousands of times. This vibrant and ever-evolving dialogue has been instrumental in breaking down barriers to trial. |
2. | Efficiently acquire new customers using performance marketing across a wide variety of digital and offline marketing channels. We pair insights and content sourced directly from our community with sophisticated in-house media measurement and optimization capabilities. This combination has enabled us to efficiently acquire a large customer base and build both interest and desire for our Grove Brands and product lines. |
3. | Enable customers to try a variety of natural and/or sustainable products, starting with their first order. This emphasis on product and brand discovery differentiates us from many other brands in the natural and sustainable market who offer a limited selection, or only have a presence in one part of the home. The natural and sustainable products industry is highly fragmented, with no clear market leader, forcing consumers to spend time and energy to research and discover new products. By moving beyond a single category, we provide our customers with a whole-home solution that not only matches their values, but is also easy, affordable, and low-risk (due to our price matching policy and 100% Happiness Guarantee, in which we commit to respond to customer service inquiries within 24 hours, and allow customers to return products within 30 days of delivery, or cancel their subscriptions at any time if they are not completely satisfied). |
• | Large & Unique Data Asset speed-to-insight brick-and-mortar |
• | The Right People |
reporting, insights, and algorithms efficiently across the different functional groups at Grove. For example, merchandisers and analysts monitor and react to on-site buying trends in near real time, and modify on-site presentation of products to drive success in key campaigns. |
• | Pragmatic Algorithms on-site and in-app recommendations to encourage product discovery and drive higher average order value. |
• | Data Privacy and Cybersecurity |
• | Subscription Engine |
• | Flexible Monthly Shipments Feature |
• | Marketing Campaigns Software-as-a-Service |
Name |
Age |
Position | ||||
Executive Officers |
||||||
Stuart Landesberg |
37 | Chief Executive Officer and Director | ||||
Sergio Cervantes |
51 | Chief Financial Officer | ||||
Christopher Clark |
37 | Chief Technology Officer and Director | ||||
Delida Costin |
52 | Chief Legal and People Officer; Secretary | ||||
Jennie Perry |
55 | Chief Marketing Officer | ||||
Jon Silverman |
49 | Senior Vice President, Physical Goods | ||||
Non-Employee Directors |
||||||
David Glazer |
38 | Director | ||||
John Replogle |
56 | Director | ||||
Kristine Miller |
58 | Director | ||||
Naytri Shroff Sramek |
32 | Director | ||||
Rayhan Arif |
35 | Director | ||||
Fumbi Chima |
48 | Director |
• | Stu Landesberg, Chief Executive Officer; |
• | Delida Costin, Chief Legal and People Officer; and |
• | Jennie Perry, Chief Marketing Officer |
Name and Principal Position |
Year |
Salary ($)(1) |
Bonus ($) |
Option Awards ($)(2) |
Stock Awards ($)(3) |
Non-Equity Incentive Plan Compensation ($) |
All Other Compensation ($) |
Total ($) |
||||||||||||||||||||||||
Stuart Landesberg |
2021 | 255,000 | — | 18,387,940 | — | — | — | 18,642,940 | ||||||||||||||||||||||||
Chief Executive Officer and President |
||||||||||||||||||||||||||||||||
Delida Costin |
2021 | 425,000 | — | 1,854,572 | 436,500 | — | — | 2,716,072 | ||||||||||||||||||||||||
Chief Legal and People Officer |
||||||||||||||||||||||||||||||||
Jennie Perry |
2021 | 404,134 | — | 2,897,846 | — | — | — | 3,301,980 | ||||||||||||||||||||||||
Chief Marketing Officer |
(1) | Ms. Perry jointed Grove on February 8, 2021. Amounts reported in this column for Ms. Perry reflect a base salary of $450,000 prorated to her start date. |
(2) | Amounts reported in this column for Mr. Landesberg and Mses. Costin and Perry reflect the aggregate grant date fair value of stock options awarded in 2021, computed in accordance with FASB ASC Topic 718, Compensation — Stock Compensation based on the following assumptions: risk-free interest rate of 0.67% — 0.69%; expected volatility of 73.66% — 73.74%; expected term of 6.0 — 6.1 years; and expected dividend rate of 0.00%. As noted above, 864,910 of the stock options granted to Mr. Landesberg vest based on market conditions. The fair value for Mr. Landesberg’s stock options with a market based vesting condition was determined using the probability weighted expected term method (“PWERM”), which involves the estimation of future potential outcomes as well as values and probabilities associated with each potential outcome. Two potential scenarios were used in the PWERM that utilized 1) the value of the Company’s common equity, and |
2) a Monte Carlo simulation to specifically value the award. The total grant date fair value of the award, based on the probable satisfaction of the market-based vesting conditions, was determined to be $5.5 million. Under FASB ASC Topic 718, due to the vesting conditions related to Mr. Landesberg’s 864,910 stock options, there is no grant date fair value below or in excess of the amount reflected in the table above for Mr. Landesberg that could be calculated and disclosed based on the achievement of the underlying conditions. |
(3) | The amount reported in this column for Ms. Costin reflects the grant date fair value of $8.73 for her RSUs, computed in accordance with FASB ASC Topic 718, calculated based on the Company’s most recent Section 409A valuation available prior to the grant date. |
Option Awards |
Equity Incentive Plan Awards |
|||||||||||||||||||||||||||||||||||
Name |
Grant Date |
Vesting Commencement Date |
Number of Securities Underlying Unexercised Options (#) Exercisable |
Number of Securities Underlying Unexercised Options (#) Unexercisable |
Equity Incentive Plan Awards: Number of Securities Underlying Unexercised Unearned Options (#) |
Option Exercise Price ($) |
Option Expiration Date |
Number of Unearned Shares, Units or Other Rights That Have Not Vested (#) |
Market or Payout Value of Unearned Shares, Units or Other Rights That Have Not Vested ($) |
|||||||||||||||||||||||||||
Stuart Landesberg |
3/30/2018 | (2) | 12/18/2017 | 2,256,324 | — | — | 0.75 | 3/29/2028 | — | — | ||||||||||||||||||||||||||
5/31/2019 | (3) | 12/21/2018 | 3,638,130 | — | — | 2.25 | 5/30/2029 | — | — | |||||||||||||||||||||||||||
2/15/2021 | (4) | 1/1/2021 | 586,309 | 2,540,673 | — | 4.43 | 2/14/2031 | — | — | |||||||||||||||||||||||||||
2/15/2021 | (5) | (5) | — | — | 864,910 | 4.43 | 2/14/2031 | — | — | |||||||||||||||||||||||||||
Delida Costin |
5/31/2019 | (6) | 5/20/2019 | 205,000 | 150,000 | — | 2.25 | 5/30/2029 | — | — | ||||||||||||||||||||||||||
1/15/2020 | (7) | 1/7/2020 | 110,000 | — | — | 2.25 | 1/14/2030 | — | — | |||||||||||||||||||||||||||
2/15/2021 | (8) | 1/1/2021 | 84,375 | 365,625 | — | 4.43 | 2/14/2031 | — | — | |||||||||||||||||||||||||||
9/22/2021 | (9) | N/A | — | — | — | — | — | 50,000 | 436,500 | |||||||||||||||||||||||||||
Jennie Perry |
2/15/2021 | (10) | 2/8/2021 | — | 700,000 | — | 4.43 | 2/14/2031 | — | — |
(1) | As of December 31, 2021, Grove’s equity was not publicly traded and, therefore, there was no ascertainable public market value for the equity on such date. The market value reported in this table is based upon a Section 409A valuation analysis of Grove’s equity as of August 31, 2021, the most recent report available. |
(2) | This option vests 25% on the first anniversary of the vesting commencement date and then vests quarterly for the next 36 months, subject to Mr. Landesberg’s continuous employment through each applicable vesting date, with accelerated vesting if Mr. Landesberg’s employment is terminated by the Company without cause or he resigns for good reason. Because these options may be early exercised for restricted stock, they are reported in this table as “Exercisable.” |
(3) | This option vests 25% on the first anniversary of the vesting commencement date and then vests quarterly for the next 36 months, subject to Mr. Landesberg’s continuous employment through each applicable vesting date, with accelerated vesting if Mr. Landesberg’s employment is terminated by the Company without cause or he resigns for good reason. Because these options may be early exercised for restricted stock, they are reported in this table as “Exercisable.” |
(4) | This option vests on the earlier of (i) if the Company’s shares are not publicly traded, such time as the Company closes a preferred or common equity financing in the amount of at least $25.0 million at a price per share of at least $15.03, (ii) if the Company’s shares (or its successor’s shares) are publicly traded, such time as the 20-day trading day volume-weighted average price is at least $15.03 per share, or (iii) immediately prior to the consummation of certain corporate transactions in which the holders of shares of the Company’s common stock will receive, in exchange for such shares, cash or other consideration the aggregate amount of $15.03 per share, subject to Mr. Landesberg’s continuous employment on the date of such milestone. |
(5) | This option vests 25% on the first anniversary of the vesting commencement date and then vests quarterly for the next 36 months, subject to Ms. Costin’s continuous employment through each applicable vesting date, with accelerated vesting following a change in control if Ms. Costin’s employment is terminated by the Company without cause or she resigns for good reason. |
(6) | This option vests 25% on the first anniversary of the vesting commencement date and then vests quarterly for the next 36 months, subject to Ms. Costin’s continuous employment through each applicable vesting date, with accelerated vesting following a change in control if Ms. Costin’s employment is terminated by the Company without cause or she resigns for good reason. Because these options may be early exercised for restricted stock, they are reported in this table as “Exercisable.” |
(7) | This option vests 25% on the first anniversary of the vesting commencement date and then vests quarterly for the next 36 months, subject to Ms. Costin’s continuous employment through each applicable vesting date, with accelerated vesting following a change in control if Ms. Costin’s employment is terminated by the Company without cause or she resigns for good reason. Because these options may be early exercised for restricted stock, they are reported in this table as “Exercisable.” |
(8) | This option vests quarterly for 48 months starting with the first quarter following the vesting commencement date, subject to Ms. Costin’s continuous employment through each applicable vesting date, with accelerated vesting following a change in control if Ms. Costin’s employment is terminated by the Company without cause or she resigns for good reason. |
(9) | The vesting the RSUs requires the satisfaction of both of two conditions: an event condition and a service condition. The event condition will be satisfied if a liquidity event occurs prior to the expiration date (five years from the grant date) subject to Ms. Costin’s continuous employment through the date of such liquidity event. The service condition is satisfied with respect to 3/8th of the RSUs on the date of the liquidity event and quarterly thereafter, subject to Ms. Costin’s continuous employment through the applicable vesting date. Any RSU for which both conditions are satisfied shall become vested. The vesting of the RSUs accelerate following a change in control if Ms. Costin’s employment is terminated by the Company without cause or she resigns for good reason. The consummation of the business combination constituted a liquidity event for purposes of the RSUs and the RSUs remain subject to the service-based vesting requirements set forth in the award agreements. |
(10) | This option vests 25% on the first anniversary of the vesting commencement date and then vests quarterly for the next 36 months, with accelerated vesting following a change in control if Ms. Perry’s employment is terminated by the Company without cause or she resigns for good reason. |
Name |
Stock Awards ($)(1) |
Option Awards ($)(1) |
Total ($) |
|||||||||
David Glazer |
659,290 | 1,141,388 | 1,800,678 | |||||||||
John Replogle |
1,640,790 | 2,853,561 | 4,494,351 |
(1) | The amount reported in this column for Messrs. Glazer and Replogle reflects the grant date fair value of $8.56 for RSUs awarded in 2021, computed in accordance with FASB ASC Topic 718, calculated based on the Company’s most recent Section 409A valuation available prior to the grant date. As of December 31, 2021, Messrs. Glazer and Replogle held outstanding RSUs with respect to 133,333 and 333,343 shares of Grove common stock, respectively. |
(2) | Amounts reported in this column for Messrs. Glazer and Replogle reflect the aggregate grant date fair value of stock options awarded in 2021, computed in accordance with FASB ASC Topic 718, Compensation — Stock Compensation based on the following assumptions: risk-free interest rate of 1.16% — 1.21%; expected volatility of 63.5% — 63.6%; expected term of 6.02 — 6.08 years; and expected dividend rate of 0.00%. As of December 31, 2021, Messrs. Glazer and Replogle held outstanding options with respect to 333,343 and 372,576 shares of Grove common stock, respectively. |
Name |
Number of Shares of Series E Preferred Stock |
Aggregate Purchase Price ($) |
||||||
SCM GC Investments Limited*(1) |
5,021,189 | $ | 49,999,995.83 |
* | Owners, together with their affiliates, of more than 5% of Grove Collaborative capital stock |
(1) | Additional details regarding this stockholder and its equity holdings are provided in this registration statement under the section “ Principal Securityholders |
Name |
Number of Shares of Series D-2 Preferred Stock |
Aggregate Purchase Price ($) |
||||||
SCM GC Investments Limited*(1) |
2,749,595 | $ | 20,000,004.11 | |||||
General Atlantic (GC), L.P.*(1) |
1,374,798 | $ | 10,000,005.69 | |||||
Norwest Venture Partners XIII, LP*(1) |
1,374,798 | $ | 10,000,005.69 | |||||
Lone Cypress, Ltd.*(1) |
766,175 | $ | 5,573,003.72 | |||||
Lone Cascade, L.P.*(1) |
528,610 | $ | 3,845,003.42 | |||||
Mayfield Select, a Cayman Islands Exempted Partnership*(1) |
274,960 | $ | 2,000,004.05 | |||||
MHS Capital Partners II, L.P.*(1) |
137,480 | $ | 1,000,002.02 | |||||
Lone Monterey Master Fund, Ltd.*(1) |
38,219 | $ | 277,997.37 | |||||
Lone Sierra, L.P.*(1) |
26,809 | $ | 195,003.31 | |||||
Lone Spruce, L.P.*(1) |
14,985 | $ | 108,997.90 | |||||
Weatherspoon Costin Family Trust(2) |
13,748 | $ | 100,000.20 | |||||
Andy Rendich |
6,874 | $ | 50,000.10 |
* | Owners, together with their affiliates, of more than 5% of Grove Collaborative capital stock |
(1) | Additional details regarding this stockholder and its equity holdings are provided in this registration statement under the section “ Principal Securityholders |
(2) | Weatherspoon Costin Family Trust is an affiliate of Delida Costin, Grove Collaborative’s Secretary and Chief Legal and People Officer. |
Name |
Number of Shares of Series D-1 Preferred Stock |
Aggregate Purchase Price ($) |
||||||
General Atlantic (GC), L.P.*(1) |
937,180 | $ | 9,999,991.76 | |||||
Norwest Ventures Partners XIII, LP*(1) |
374,872 | $ | 3,999,996.72 | |||||
Lone Cypress, Ltd.*(1) |
349,716 | $ | 3,731,574.64 | |||||
Mayfield Select, a Cayman Islands Exempted Limited Partnership*(1) |
93,718 | $ | 999,999.18 | |||||
Lone Spruce, L.P.*(1) |
6,410 | $ | 68,396.63 |
* | Owners, together with their affiliates, of more than 5% of Grove Collaborative capital stock |
(1) | Additional details regarding this stockholder and its equity holdings are provided in this registration statement under the section “ Principal Securityholders |
Name |
Number of Shares of Series D Preferred Stock |
Aggregate Purchase Price ($) |
||||||
Lone Cypress, Ltd.*(1) |
6,534,759 | $ | 53,899,999.19 | |||||
General Atlantic (GC), L.P. *(1) |
5,823,008 | $ | 48,029,994.45 | |||||
Norwest Venture Partners XIII, LP*(1) |
1,382,119 | $ | 11,399,993.93 | |||||
MHS Capital Partners G2, LLC*(1) |
373,414 | $ | 3,079,993.37 | |||||
Mayfield Select, a Cayman Islands Exempted Limited Partnership*(1) |
121,238 | $ | 999,995.28 | |||||
OBV Rooted, LLC(2) |
50,920 | $ | 419,998.35 | |||||
MHS Capital Partners II, L.P.*(1) |
26,672 | $ | 219,996.00 |
* | Owners, together with their affiliates, of more than 5% of Grove Collaborative capital stock |
(1) | Additional details regarding this stockholder and its equity holdings are provided in this registration statement under the section “ Principal Securityholders |
(2) | OBV Rooted, LLC is an affiliate of John Replogle, a member of Grove Collaborative’s board of directors. |
• | each person known by the Company to be the beneficial owner of more than 5% of outstanding Class A Common Stock; |
• | each of the Company’s current named executive officers and directors; and |
• | all current executive officers and directors of the Company as a group. |
Name and Address of Beneficial Owners |
Number of Shares of Class A Common Stock(2) |
% |
Number of Shares of Class B Common Stock |
% |
||||||||||||
Directors and current named executive officers(1): |
||||||||||||||||
Stu Landesberg(3) |
9,807,070 | (4) | 17.7 | % | 9,804,370 | 7.8 | % | |||||||||
Fumbi Chima |
— | — | — | — | ||||||||||||
Chris Clark |
1,814,554 | (5) | 3.9 | % | 1,486,717 | 1.3 | % | |||||||||
Delida Costin(6) |
953,493 | (7) | 2.1 | % | 144,866 | * | ||||||||||
Jennie Perry |
521,039 | (8) | 1.1 | % | 521,039 | * | ||||||||||
David Glazer |
33,672 | (9) | * | 30,672 | * | |||||||||||
John Replogle(10) |
316,906 | (11) | * | 90,436 | * | |||||||||||
Rayhan Arif |
— | — | — | — | ||||||||||||
Kristine Miller |
— | — | — | — | ||||||||||||
Naytri Shroff Sramek |
— | — | — | — | ||||||||||||
All directors and executive officers of the Company as a group (12 persons) |
14,357,837 | 24.2 | % | 12,225,467 | 9.1 | % | ||||||||||
Entities associated with Virgin(12) |
29,969,052 | 53.4 | % | — | — | |||||||||||
Entities associated with Mayfield(13) |
15,867,361 | (14) | 25.9 | % | 15,667,361 | 13.4 | % |
Name and Address of Beneficial Owners |
Number of Shares of Class A Common Stock(2) |
% |
Number of Shares of Class B Common Stock |
% |
||||||||||||
Norwest Venture Partners XIII, LP(15) |
15,990,008 | (16) | 19.9 | % | 15,489,908 | 13.2 | % | |||||||||
General Atlantic (GC), L.P.(17) |
13,436,978 | (18) | 9.9 | % | 12,936,878 | 11.0 | % | |||||||||
Entities associated with Lone Pine Capital(19) |
11,397,381 | (20) | 9.9 | % | 10,897,381 | 9.3 | % | |||||||||
Entities associated with MHS Capital(21) |
10,535,912 | (22) | 18.8 | % | 10,435,612 | 8.9 | % | |||||||||
SCM GC Investments Limited(23) |
10,893,484 | (24) | 19.6 | % | 9,956,536 | 8.5 | % | |||||||||
Entities associated with NextView Ventures(24) |
7,030,563 | (25) | 13.4 | % | 6,980,263 | 6.0 | % |
1 | The business address of each of Stuart Landesberg, Fumbi Chima, Chris Clark, Delida Costin, Jennie Perry, David Glazer, John Replogle, Rayhan Arif, Kristine Miller and Naytri Shroff Sramek 1301 Sansome Street, San Francisco, CA 94111. |
2 | The beneficial ownership of the Company as of July 14, 2022 is based on (A) 45,570,178 shares of Class A Common Stock outstanding as of as of such date and (B) 117,233,055 shares of Class B Common Stock as of such date. |
3 | Includes 679,357 shares of Class B Common Stock and 100 shares of Class A Common Stock that are held by the Landesberg Living Trust. Mr. Landesberg may be deemed to have voting and dispositive investment power with respect to the shares held by the Landesberg Living Trust. |
4 | Includes 9,904,370 shares of Class B Common Stock that are convertible into shares of Class A Common Stock on a one-for-one |
5 | Includes 1,486,717 shares of Class B Common Stock that are convertible into shares of Class A Common Stock on a one-for-one |
6 | Consists of 17,515 shares of Class B Common Stock and 100 shares of Class A Common Stock that are held by the Weatherspoon Costin Family Trust. Ms. Costin may be deemed to have voting and dispositive investment power with respect to the shares held by the Weatherspoon Costin Family Trust. |
7 | Includes 144,866 shares of Class B Common Stock that are convertible into shares of Class A Common Stock on a one-for-one |
8 | Includes 521,039 shares of Class B Common Stock that are convertible into shares of Class A Common Stock on a one-for-one |
9 | Includes 30,672 shares of Class B Common Stock that are convertible into shares of Class A Common Stock on a one-for-one |
10 | Consists of 24 shares of Class B Common Stock and 267 shares of Class A Common Stock that are held by the Replogle Family LLC. Mr. Replogle serves as the manager of Replogle Family LLC may be deemed to have voting and dispositive investment power with respect to the shares held by the Replogle Family LLC. |
11 | Includes 90,436 shares of Class B Common Stock that are convertible into shares of Class A Common Stock on a one-for-one |
12 | Includes 9,972,500 shares of Class A Common Stock held of record by the Sponsor, 6,700,000 warrants to acquire Class A Common Stock held of record by the Sponsor, 9,421,524 shares of Class A Common Stock held of record by the Backstop Investor, and 3,875,028 warrants to acquire Class A Common Stock held of record by the Backstop Investor. The Backstop Investor is the sole managing member and manager of the Sponsor, and is wholly owned by Virgin Group Holdings Limited (“Virgin Group Holdings”). Virgin Group Holdings is owned by Sir Richard Branson, and he has the ability to appoint and remove the management of Virgin Group Holdings and, as such, may indirectly control the decisions of Virgin Group Holdings, regarding the voting and disposition of securities held by Virgin Group Holdings. Therefore, Sir Richard Branson may be deemed to have indirect beneficial ownership of the shares held by the Sponsor and the Backstop Investor. The address of Virgin Group Holdings Limited is Craigmuir Chambers, Road Town, Tortola, VG1110, British Virgin Islands and the address of the Backstop Investor is Craigmuir Chambers, Road Town, Tortola, VG1110, British Virgin Islands. |
13 | Consists of 13,312,440 shares of Class B Common Stock held by Mayfield XV, a Cayman Islands Exempted Limited Partnership (“MF XV”) and 2,354,921 shares of Class B Common Stock and |
200,000 shares of Class A Common Stock held by Mayfield Select, a Cayman Islands Exempted Limited Partnership (“MF Select”). Mayfield XV Management (UGP), Ltd., a Cayman Islands Exempted Company (“MF XV UGP)” is the general partner of Mayfield XV Management (EGP), L.P., a Cayman Islands Exempted Limited Partnership, which is the general partner of MF XV. Rajeev Batra, Navin Chaddha and Urshit Parikh are the directors of MF XV UGP. As a result, each of the foregoing entities and individuals may be deemed to share beneficial ownership of the shares owned by MF XV, but each of the individuals disclaims such beneficial ownership. Mayfield Select Management (UGP), Ltd., a Cayman Islands Exempted Company (“MF Select UGP”) is the general partner of Mayfield Select Management (EGP), L.P., a Cayman Islands Exempted Limited Partnership, which is the general partner of MF Select. Rajeev Batra, Navin Chaddha and Urshit Parikh are the directors of MF Select UGP. As a result, each of the foregoing entities and individuals may be deemed to share beneficial ownership of the shares owned by MF Select, but each of the individuals disclaims such beneficial ownership. The address for each of these entities and individuals is c/o Mayfield, 2484 Sand Hill Road, Menlo Park, CA 94025. |
14 | Includes 15,667,361 shares of Class B Common Stock that are convertible into shares of Class A Common Stock on a one-for-one |
15 | Includes 15,489,908 shares of Class B Common Stock and 500,100 shares of Class A Common Stock held of record by Norwest Venture Partners XIII, LP (“NVP XIII”). However, pursuant to a letter agreement between NVP XIII and Grove, NVP XIII has relinquished its right to convert shares of Class B Common Stock held of record by the NVP XIII into shares of Class A Common Stock to the extent that, after giving effect to such conversion, the NVP XIII, together with any other holder whose ownership may aggregated with that of the NVP XIII, collectively would beneficially own in excess of 19.99%. Genesis VC Partners XIII, LLC is the general partner of NVP XIII, and NVP Associates, LLC is the managing member of Genesis VC Partners XIII, LLC. Each of Promod Haque, Jeffrey Crowe, and Jon Kossow, who are co-chief executive officers of NVP Associates, LLC, may be deemed to share voting and dispositive power over the shares held by NVP XIII. Mr. Crowe disclaims beneficial ownership of all such shares, except to the extent of his pecuniary interest therein, if any. The address for each of these entities and individuals is c/o 525 University Avenue, #800, Palo Alto, California 94301. |
16 | Includes 15,489,908 shares of Class B Common Stock that are convertible into shares of Class A Common Stock on a one-for-one |
17 | Includes 12,936,878 shares of Class B Common Stock and 500,100 shares of Class A Common Stock held of record by General Atlantic (GC), L.P. (“GA GC”). However, pursuant to a letter agreement between GA GC and Grove, GA GC has relinquished its right to convert shares of Class B Common Stock held of record by GA GC into shares of Class A Common Stock to the extent that, after giving effect to such conversion, GA GC, together with any other holder whose ownership may aggregated with that of GA GC, collectively would beneficially own in excess of 9.99%. The limited partners that share beneficial ownership of the shares held by GA GC are the following General Atlantic investment funds (the “GA Funds”): General Atlantic Partners 100, L.P. (“GAP 100”), General Atlantic Partners (Bermuda) EU, L.P. (“GAP Bermuda EU”), GAP Coinvestments III, LLC (“GAPCO III”), GAP Coinvestments IV, LLC (“GAPCO IV”), GAP Coinvestments V, LLC (“GAPCO V”) and GAP Coinvestments CDA, L.P. (“GAPCO CDA”). The general partner of GA GC is General Atlantic (SPV) GP, LLC (“GA SPV”). The general partner of GAP 100 is ultimately controlled by General Atlantic, L.P. (“GA LP”), which is controlled by the Management Committee of GASC MGP, LLC (the “Management Committee”). The general partner of GAP Bermuda EU is ultimately controlled by GAP (Bermuda) L.P. (“GAP Bermuda”), which is also controlled by the Management Committee. GA LP is the managing member of GAPCO III, GAPCO IV and GAPCO V, the general partner of GAPCO CDA and is the sole member of GA SPV. There are nine members of the Management Committee. GA GC, GA LP, GAP Bermuda, GA SPV and the GA Funds (collectively, the “GA Group”) are a “group” within the meaning of Rule 13d-5 of the Securities Exchange Act of 1934, as amended. The mailing address of the foregoing General Atlantic entities, other than GAP Bermuda EU and GAP Bermuda, is c/o General Atlantic Service Company, L.P., 55 East 52nd Street, 33rd Floor, New York, NY 10055. The mailing address of GAP Bermuda EU and GAP Bermuda is Clarendon House, 2 Church Street, Hamilton HM 11, Bermuda. Each of the members of the Management Committee disclaims ownership of the shares except to the extent that he has a pecuniary interest therein. |
18 | Includes 12,936,878 shares of Class B Common Stock that are convertible into shares of Class A Common Stock on a one-for-one |
19 | Includes 9,330,505 shares of Class B Common Stock and 166,825 shares of Class A Common Stock held of record by Lone Cypress, Ltd., 1,144,864 shares of Class B Common Stock and 309,643 shares of Class A Common Stock held of record by Lone Cascade, L.P., 391,171 shares of Class B Common Stock and 2,713 shares of Class A Common Stock held of record by Lone Spruce, L.P, 12,641 shares of Class B Common Stock and 11,236 shares of Class A Common Stock held of record by Lone Monterey Master Fund, Ltd., and 18,200 shares of Class B Common Stock and 9,583 shares of Class A Common Stock held of record by Lone Sierra, L.P. However, pursuant to a letter agreement between Lone Pine Capital and Grove, Lone Pine Capital has relinquished its right to convert shares of Class B Common Stock held of record by the Long Pine Funds into shares of Class A Common Stock to the extent that, after giving effect to such conversion, the Lone Pine Funds, together with any other holder whose ownership may aggregated with that of the Lone Pine Funds, collectively would beneficially own in excess of 9.99%. Lone Pine Capital LLC, a Delaware limited liability company (“Lone Pine Capital”), serves as investment manager to Lone Cypress, Ltd., a Cayman Islands exempted company, Lone Cascade, L.P., a Delaware limited partnership, Lone Monterey Master Fund, Ltd., a Cayman Islands exempted company, Lone Spruce, L.P., a Delaware limited partnership, Lone Sierra, L.P., a Delaware limited partnership (collectively, the “Lone Pine Funds”), with respect to the securities of the Company directly held by each of the Lone Pine Funds and has the authority to dispose of and vote the securities of the Company directly held by the Lone Pine Funds. Each of David F. Craver, Brian F. Doherty, Kelly A. Granat and Kerry A. Tyler is an Executive Committee Member of Lone Pine Managing Member LLC, which is the Managing Member of Lone Pine Capital, with respect to the securities directly held by each of the Lone Pine Funds. Stephen F. Mandel, Jr. is the Managing Member of Lone Pine Managing Member LLC, which is the Managing Member of Lone Pine Capital, with respect to the securities directly held by each of the Lone Pine Funds. Each of David F. Craver, Brian F. Doherty, Kelly A. Granat, Kerry A. Tyler, and Stephen F. Mandel, Jr. may be deemed to beneficially own the securities held by the Lone Pine Funds and each of them disclaims beneficial ownership of these securities. The business address of Lone Pine Capital LLC and the Executive Committee Members is Two Greenwich Plaza, Greenwich, Connecticut 06830. |
20 | Includes 10,897,381 shares of Class B Common Stock that are convertible into shares of Class A Common Stock on a one-for-one |
21 | Includes 8,093,070 shares of Class B Common Stock and 100,100 shares of Class A Common Stock held of record by MHS Capital Partners II, L.P., 1,857,640 shares of Class B Common Stock and 100 shares of Class A Common Stock held of record by MHS Capital Partners G, LLC, and 484,902 shares of Class B Common Stock and 100 shares of Class A Common Stock held of record by MHS Capital Partners G2, LLC. MHS Capital Management, LLC is the general partner of MHS Capital Partners, LP. MHS Capital Management II, LLC is the Managing Member of MHS Capital Partners G, LLC and MHS Capital Partners G2, LLC. Mark Sugarman, who is the Manager of MHS Capital Management, LLC, and MHS Capital Management II, LLC may be deemed to share voting and dispositive power over the shares held by MHS Capital Partners, LP, MHS Capital Partners G, LLC and MHS Capital Partners G2, LLC. Mr. Sugarman disclaims beneficial ownership of all such shares, except to the extent of his pecuniary interest therein, if any. The address for each of these entities and individuals is c/o 2121 S. El Camino Real, Ste 200, San Mateo, CA 94403. |
22 | Includes 10,435,612 shares of Class B Common Stock that are convertible into shares of Class A Common Stock on a one-for-one |
23 | Includes 9,956,536 shares of Class B Common Stock and 100 shares of Class A Common Stock held of record by SCM GC Investments Limited (“SCMGC”), 65,150 shares of Class A Common Stock held by Sculptor Enhanced Master Fund, Ltd. (“SCEN”) and 434,850 shares of Class A Common Stock held by Sculptor Master Fund, Ltd. (“SCMF”). Additionally, based on the information provided to the Company on or prior to May 13, 2022, this number also includes 238,534 shares of Class A Common Stock and 48,633 warrants to acquire Class A Common Stock held of record by Sculptor Special Funding, LP (“NRMD”), a Cayman Islands company, 54,605 shares of Class A Common Stock and 10,921 warrants to acquire Class A Common Stock held of record by Sculptor Credit Opportunities Master Fund, Ltd. (“SCCO”), a Cayman |
Islands company, 16,296 shares of Class A Common Stock and 2,333 warrants to acquire Class A Common Stock held of record by SCEN, a Cayman Islands company, and 54,605 shares of Class A Common Stock and 10,921 warrants to acquire Class A Common Stock held of record by Sculptor SC II, LP (“SCII”), a Delaware company. Sculptor Capital LP (“Sculptor”), a Delaware limited partnership, is the investment adviser to NRMD, SCCO, SCEN, and SCMF and thus may be deemed a beneficial owner of the shares in the accounts managed by Sculptor. Sculptor Capital II LP (“Sculptor II”), a Delaware limited partnership, is the investment adviser to SCII, and thus may be deemed a beneficial owner of the shares in the accounts managed by Sculptor II. Sculptor Capital Holding Corporation, a Delaware corporation (“SCHC”), serves as the sole general partner of Sculptor and Sculptor II. As such, SCHC may be deemed to control Sculptor and Sculptor II and, therefore, may be deemed a beneficial owner of the shares in the accounts managed by Sculptor and Sculptor II. Sculptor Capital Management, Inc. (“SCU”), a Delaware corporation, is the sole shareholder of SCHC, and may be deemed a beneficial owner of the shares in the accounts managed by Sculptor and Sculptor II. SCMGC is beneficially owned by SCMF and SCEN, and may be deemed a beneficial owner of the shares. The business address of NRMD, SCCO, SCEN, SCII, Sculptor, Sculptor II, SCHC, SCMF, SCMGC and SCU is 9 West 57 Street, 39 Floor, New York, NY 10019. |
24 | Includes 9,956,536 shares of Class B Common Stock that are convertible into shares of Class A Common Stock on a one-for-one |
25 | Consists of 4,684,890 shares of Class B Common Stock and 50,100 shares of Class A Common Stock held of record by NextView Ventures II, L.P, 1,749,024 shares of Class B Common Stock and 100 shares of Class A Common Stock held of record by NextView Ventures II-A, L.P. and 546,349 shares of Class B Common Stock and 100 shares of Class A Common Stock held of record by NextView Ventures I Co-Invest Fund, L.P. Lee Hower, David Beisel and Rob Go as Managing Members of Nextview Capital Partners II, LLC, the General Partner of NextView Ventures II, L.P. exercise voting and investment power with respect to the securities and may be deemed to be the beneficial owner of the securities held by NextView Ventures II, L.P. NextView Ventures II, L.P.’s business address is 179 Lincoln Street, Suite 404, Boston, MA 02111. |
26 | Includes 6,980,263 shares of Class B Common Stock that are convertible into shares of Class A Common Stock on a one-for-one |
Name of Selling Holder |
Number of Shares of Class A Common Stock Beneficially Owned |
Maximum Number of Shares of Class A Common Stock Being Offered |
Shares of Class A Common Stock Beneficially Owned After the Offered Shares of Class A Common Stock Are Sold |
|||||||||||||||||
Number(1) |
Percent |
Number(2) |
Percent |
|||||||||||||||||
YA II PN, Ltd.(3) |
0 | — | 32,544,366 | 0 | — |
(1) | In accordance with Rule 13d-3(d) under the Exchange Act, we have excluded from the number of shares beneficially owned prior to the offering all of the shares that the Selling Holder may be required to purchase under the Purchase Agreement, because the issuance of such shares is at our discretion and is subject to conditions contained in the Purchase Agreement, the satisfaction of which are entirely outside of the Selling Holder’s control, including the registration statement that includes this prospectus becoming and remaining effective. Furthermore, the Advances of Class A Common Stock under the Purchase Agreement are subject to certain agreed upon maximum amount limitations set forth in the Purchase Agreement. Also, the Purchase Agreement prohibits us from issuing and selling any shares of our Class A Common Stock to the Selling Holder to the extent such shares, when aggregated with all other shares of our Class A Common Stock then beneficially owned by the Selling Holder, would cause the Selling Holder’s beneficial ownership of our Class A Common Stock to exceed the 9.99% Beneficial Ownership Limitation. The Purchase Agreement also prohibits us from issuing or selling shares of our Class A Common Stock under the Purchase Agreement in excess of the 19.99% Exchange Cap, unless we obtain stockholder approval to do so, or unless all applicable sales of shares of Class A Common Stock under the Purchase Agreement equal or exceed the “Minimum Price” (as such term is defined in Section 312.04 of the NYSE Listed Company Manual) or, as to any Advance, the issuance of the Class A Common Stock pursuant to an Advance Notice would be excluded from the Exchange Cap under NYSE rules (or interpretive guidance provided by the NYSE with respect thereto), in which case the Exchange Cap limitation would no longer apply under applicable NYSE rules. |
(2) | Assumes the sale of all shares being offered pursuant to this prospectus. |
(3) | YA II PN, Ltd. is a fund managed by Yorkville Advisors Global, LP (“Yorkville LP”). Yorkville Advisors Global II, LLC (“Yorkville LLC”) is the General Partner of Yorkville LP. All investment decisions for YA II PN, Ltd. are made by Yorkville LLC’s President and Managing Member, Mr. Mark Angelo. The business address of YA is 1012 Springfield Avenue, Mountainside, NJ 07092. |
(1) | the board of directors approves the acquisition of stock or the merger transaction before the time that the person becomes an interested stockholder; |
(2) | the interested stockholder owns at least 85% of the outstanding voting stock of the corporation at the time the merger transaction commences (excluding voting stock owned by directors who are also officers and certain employee stock plans); or |
(3) | the merger transaction is approved by the board of directors and at a meeting of stockholders, not by written consent, by the affirmative vote of 2/3 of the outstanding voting stock which is not owned by the interested stockholder. |
• | in whole and not in part; |
• | at a price of $0.01 per warrant; |
• | upon not less than 30 days’ prior written notice of redemption to each warrant holder; and |
• | if, and only if, the last reported sale price of the Class A Common Stock for any 20 trading days within a 30-trading-day |
• | in whole and not in part; |
• | at $0.10 per warrant upon a minimum of 30 days’ prior written notice of redemption, provided that holders will be able to exercise their warrants on a cashless basis prior to redemption and receive that number of shares determined by reference to the table below, based on the redemption date and the “fair market value” of Class A Common Stock (as defined below); |
• | if, and only if, the Reference Value (as defined above under “ Redemption of Warrants When the Price per Class A Common Stock Equals or Exceeds $18.00 sub-divisions, share dividends, reorganizations, reclassifications, recapitalizations, and the like); and |
• | if the Reference Value is less than $18.00 per share (as adjusted for share sub-divisions, share capitalizations, reorganizations, recapitalizations, and the like) the Private Placement Warrants must also be concurrently called for redemption on the same terms as the outstanding public warrants, as described above. |
Redemption Date (period to expiration of warrants) |
$Fair Market Value of Class A Ordinary Shares |
|||||||||||||||||||||||||||||||||||
≥ $10.00 |
$11.00 |
$12.00 |
$13.00 |
$14.00 |
$15.00 |
$16.00 |
$17.00 |
≥ $18.00 |
||||||||||||||||||||||||||||
60 months |
0.261 | 0.281 | 0.297 | 0.311 | 0.324 | 0.377 | 0.348 | 0.358 | 0.361 | |||||||||||||||||||||||||||
57 months |
0.257 | 0.277 | 0.294 | 0.310 | 0.324 | 0.337 | 0.348 | 0.358 | 0.365 | |||||||||||||||||||||||||||
54 months |
0.252 | 0.272 | 0.291 | 0.307 | 0.322 | 0.335 | 0.347 | 0.357 | 0.365 | |||||||||||||||||||||||||||
51 months |
0.246 | 0.268 | 0.287 | 0.304 | 0.320 | 0.333 | 0.346 | 0.357 | 0.365 | |||||||||||||||||||||||||||
48 months |
0.241 | 0.263 | 0.283 | 0.301 | 0.317 | 0.332 | 0.344 | 0.356 | 0.365 | |||||||||||||||||||||||||||
45 months |
0.235 | 0.258 | 0.279 | 0.298 | 0.315 | 0.330 | 0.343 | 0.356 | 0.365 | |||||||||||||||||||||||||||
42 months |
0.228 | 0.252 | 0.274 | 0.294 | 0.312 | 0.328 | 0.342 | 0.355 | 0.364 | |||||||||||||||||||||||||||
39 months |
0.221 | 0.246 | 0.269 | 0.290 | 0.309 | 0.325 | 0.340 | 0.354 | 0.364 | |||||||||||||||||||||||||||
36 months |
0.213 | 0.239 | 0.263 | 0.285 | 0.305 | 0.323 | 0.339 | 0.353 | 0.364 | |||||||||||||||||||||||||||
33 months |
0.205 | 0.232 | 0.257 | 0.280 | 0.301 | 0.320 | 0.337 | 0.352 | 0.364 | |||||||||||||||||||||||||||
30 months |
0.196 | 0.224 | 0.250 | 0.274 | 0.297 | 0.316 | 0.335 | 0.351 | 0.364 | |||||||||||||||||||||||||||
27 months |
0.185 | 0.214 | 0.242 | 0.268 | 0.291 | 0.313 | 0.332 | 0.350 | 0.364 | |||||||||||||||||||||||||||
24 months |
0.173 | 0.204 | 0.233 | 0.260 | 0.285 | 0.308 | 0.329 | 0.348 | 0.364 | |||||||||||||||||||||||||||
21 months |
0.161 | 0.193 | 0.223 | 0.252 | 0.279 | 0.304 | 0.326 | 0.347 | 0.364 | |||||||||||||||||||||||||||
18 months |
0.146 | 0.179 | 0.211 | 0.242 | 0.271 | 0.298 | 0.322 | 0.345 | 0.363 | |||||||||||||||||||||||||||
15 months |
0.130 | 0.164 | 0.197 | 0.230 | 0.262 | 0.291 | 0.317 | 0.342 | 0.363 | |||||||||||||||||||||||||||
12 months |
0.111 | 0.146 | 0.181 | 0.216 | 0.250 | 0.282 | 0.312 | 0.339 | 0.363 | |||||||||||||||||||||||||||
9 months |
0.090 | 0.125 | 0.162 | 0.199 | 0.237 | 0.272 | 0.305 | 0.336 | 0.362 | |||||||||||||||||||||||||||
6 months |
0.065 | 0.099 | 0.137 | 0.178 | 0.219 | 0.259 | 0.296 | 0.331 | 0.362 | |||||||||||||||||||||||||||
3 months |
0.034 | 0.065 | 0.104 | 0.150 | 0.197 | 0.243 | 0.286 | 0.326 | 0.361 | |||||||||||||||||||||||||||
0 months |
— | — | 0.042 | 0.115 | 0.179 | 0.233 | 0.281 | 0.323 | 0.361 |
• | ordinary brokers’ transactions; |
• | transactions involving cross or block trades; |
• | through brokers, dealers, or underwriters who may act solely as agents; |
• | “at the market” into an existing market for our Class A Common Stock; |
• | in other ways not involving market makers or established business markets, including direct sales to purchasers or sales effected through agents; |
• | in privately negotiated transactions; or |
• | any combination of the foregoing. |
• | an individual who is a United States citizen or resident of the United States; |
• | a corporation or other entity treated as a corporation for United States federal income tax purposes created in, or organized under the law of, the United States or any state or political subdivision thereof; |
• | an estate the income of which is includible in gross income for United States federal income tax purposes regardless of its source; or |
• | a trust (A) the administration of which is subject to the primary supervision of a United States court and which has one or more United States persons (within the meaning of the Code) who have the authority to control all substantial decisions of the trust or (B) that has in effect a valid election under applicable Treasury regulations to be treated as a United States person. |
• | the gain is effectively connected with the conduct of a trade or business by the non-U.S. Holder within the United States (and, if an applicable tax treaty so requires, is attributable to a U.S. permanent establishment or fixed base maintained by the non-U.S. Holder); |
• | the non-U.S. Holder is an individual who is present in the United States for 183 days or more in the taxable year of disposition and certain other conditions are met; or |
• | we are or have been a “United States real property holding corporation” for U.S. federal income tax purposes. |
Page |
||||
Virgin Group Acquisition Corp. II - Index to Audited Financial Statements |
||||
F-2 | ||||
Financial Statements: |
||||
F-3 | ||||
F-4 | ||||
F-5 | ||||
F-6 | ||||
F-7 to F-21 | ||||
F-22 | ||||
F-23 | ||||
F-24 | ||||
F-25 | ||||
F-26 to F-44 | ||||
Grove Collaborative, Inc. - Index to Audited Financial Statements |
||||
F-45 | ||||
Financial Statements: |
||||
F-46 | ||||
F-47 | ||||
F-48 | ||||
F-49 | ||||
F-51 to F-76 |
||||
Unaudited Condensed Financial Statements: |
||||
F-77 | ||||
F-78 | ||||
F-79 | ||||
F-80 | ||||
F-81 to F-97 |
ASSETS: |
| |||
Current Assets: |
| |||
Cash |
$ | |||
Prepaid expenses |
||||
|
|
|||
Total current assets |
||||
Prepaid expenses – non-current portion |
||||
Cash and investments held in trust account |
||||
|
|
|||
TOTAL ASSETS |
$ |
|||
|
|
|||
LIABILITIES, REDEEMABLE ORDINARY SHARES AND SHAREHOLDERS’ DEFICIT |
||||
Current liabilities: |
||||
Accrued costs and expenses |
$ | |||
Due to related party |
||||
Promissory note – related party |
||||
|
|
|||
Total current liabilities |
||||
Derivative warrant liabilities |
||||
Deferred underwriters’ discount |
||||
|
|
|||
Total liabilities |
||||
Commitments and Contingencies (Note 7) |
||||
Class A ordinary shares, $ |
||||
Shareholders’ Deficit: |
||||
Preference shares, $ |
||||
Class B ordinary shares, $ |
||||
Additional paid-in capital |
||||
Accumulated deficit |
( |
) | ||
|
|
|||
Total Shareholders’ deficit |
( |
) | ||
|
|
|||
TOTAL LIABILITIES, REDEEMABLE ORDINARY SHARES AND SHAREHOLDERS’ DEFICIT |
$ |
|||
|
|
Formation and operating costs |
$ | |||
Loss from operations |
( |
) | ||
Other income (expense) |
||||
Interest income earned on cash and investments held in trust account |
||||
Offering costs allocated to warrants |
( |
) | ||
Change in fair value of warrant liabilities |
||||
Total other income |
||||
Net income |
$ | |||
Basic and diluted weighted average shares outstanding, Class A ordinary shares |
||||
Basic and diluted net income per ordinary share, Class A ordinary shares |
$ | |||
Basic and diluted weighted average shares outstanding, Class B ordinary shares |
||||
Basic and diluted net income per ordinary share, Class B ordinary shares |
$ | |||
Class B Ordinary Shares |
||||||||||||||||||||
Shares |
Amount |
Additional Paid In Capital |
Accumulated Deficit |
Total Shareholders’ Deficit |
||||||||||||||||
Balance as of January 13, 2021 (inception) |
$ | $ | $ | $ | ||||||||||||||||
Issuance of Class B Ordinary shares to Sponsor |
||||||||||||||||||||
Accretion for Class A Ordinary Shares to redemption amount |
( |
) | ( |
) | ( |
) | ||||||||||||||
Net incom e |
— | — | ||||||||||||||||||
|
|
|
|
|
|
|
|
|
|
|||||||||||
Balance as of December 31, 2021 |
$ |
$ |
$ |
( |
) |
$ |
( |
) | ||||||||||||
|
|
|
|
|
|
|
|
|
|
Cash flows from operating activities: |
||||
Net income |
$ | |||
Adjustments to reconcile net income to net cash used in operating activities: |
||||
Interest income on cash and investments held in Trust Account |
( |
) | ||
Offering costs allocated to derivative warrant liabilities |
||||
Change in fair value of derivative warrant liabilities |
( |
) | ||
Changes in operating assets and liabilities: |
||||
Prepaid assets |
( |
) | ||
Accrued costs and expenses |
||||
Due to related party |
||||
|
|
|||
Net cash used in operating activities |
( |
) | ||
|
|
|||
Cash Flows from Investing Activities: |
||||
Investment of cash in Trust Account |
( |
) | ||
|
|
|||
Net cash used in investing activities |
( |
) | ||
|
|
|||
Cash flows from financing activities: |
||||
Proceeds from purchase of Class B shares by initial shareholder |
||||
Proceeds from initial public offering, net of underwriters’ discount |
||||
Proceeds from private placement |
||||
Proceeds from notes payable—related party |
||||
Payment of offering costs |
( |
) | ||
|
|
|||
Net cash provided by financing activities |
||||
|
|
|||
Net change in cash |
||||
Cash, beginning of the period |
||||
|
|
|||
Cash, end of the period |
$ | |||
|
|
|||
Supplemental disclosure of cash flow information: |
||||
Deferred underwriting commissions charged to temporary equity |
$ | |||
|
|
• | Level 1, defined as observable inputs such as quoted prices (unadjusted) for identical instruments in active markets; |
• | Level 2, defined as inputs other than quoted prices in active markets that are either directly or indirectly observable such as quoted prices for similar instruments in active markets or quoted prices for identical or similar instruments in markets that are not active; and |
• | Level 3, defined as unobservable inputs in which little or no market data exists, therefore requiring an entity to develop its own assumptions, such as valuations derived from valuation techniques in which one or more significant inputs or significant value drivers are unobservable. |
For the period from January 13, 2021 (inception) to December 31, 2021 |
||||||||
Class A |
Class B |
|||||||
Basic and diluted net income per share: |
||||||||
Numerator: |
||||||||
Allocation of net income |
$ | $ | ||||||
Denominator: |
||||||||
Weighted-average shares outstanding including shares subject to redemption |
||||||||
Basic and diluted net income per share |
$ | $ | ||||||
Gross proceeds from IPO |
$ | |||
Less: |
||||
Proceeds allocated to Public Warrants |
( |
) | ||
Ordinary share issuance costs |
( |
) | ||
Plus: |
||||
Accretion of carrying value to redemption value |
||||
Contingently redeemable ordinary shares |
$ |
December 31, 2021 |
Quoted Prices In Active Markets (Level 1) |
Significant Other Observable Inputs (Level 2) |
Significant Other Unobservable Inputs (Level 3) |
|||||||||||||
Assets: |
||||||||||||||||
Mutual Fund held in Trust Account |
$ | $ | — | $ | — | |||||||||||
|
|
|
|
|
|
|
|
|||||||||
Liabilities: |
||||||||||||||||
Derivative warrant liability –Public Warrants |
$ | $ | $ | — | $ | — | ||||||||||
Derivative warrant liability –Private Warrants |
— | — | ||||||||||||||
|
|
|
|
|
|
|
|
|||||||||
Derivative warrant liabilities |
$ | $ | $ | — | $ | |||||||||||
|
|
|
|
|
|
|
|
December 31, 2021 |
||||
Strike price |
$ | |||
Share price |
$ | |||
Volatility |
% | |||
Risk-free rate |
% | |||
Expected term (years) |
• | in whole and not in part; |
• | at a price of $ |
• | upon not less than “30-day redemption period”) to each warrant holder; and |
• | if, and only if, the reported closing price of the Class A ordinary shares equals or exceeds $ |
Private Placement Warrants |
Public Warrants |
Warrant Liabilities |
||||||||||
Derivative warrant liabilities – initial measurement |
$ | $ | $ | |||||||||
Transfer to Level 1 |
( |
) | ( |
) | ||||||||
Change in fair value of derivative warrant liabilities |
( |
) | ( |
) | ||||||||
|
|
|
|
|
|
|||||||
Derivative warrant liabilities at December 31, 2021 |
$ | $ | $ | |||||||||
|
|
|
|
|
|
March 31, 2022 (Unaudited) |
December 31, 2021 |
|||||||
ASSETS: |
||||||||
Current Assets: |
||||||||
Cash |
$ | $ | ||||||
Prepaid expenses |
||||||||
|
|
|
|
|||||
Total current assets |
||||||||
Prepaid expenses – non-current portion |
||||||||
Investments held in trust account |
||||||||
|
|
|
|
|||||
TOTAL ASSETS |
$ |
$ |
||||||
|
|
|
|
|||||
LIABILITIES, REDEEMABLE ORDINARY SHARES AND SHAREHOLDERS’ DEFICIT |
||||||||
Current Liabilities: |
||||||||
Accrued costs and expenses |
$ | $ | ||||||
Due to related party |
||||||||
Promissory note – related party |
||||||||
|
|
|
|
|||||
Total current liabilities |
||||||||
Derivative warrant liabilities |
||||||||
Backstop derivative liability |
— |
|||||||
Deferred underwriter’s discount |
||||||||
|
|
|
|
|||||
Total liabilities |
||||||||
Commitments and Contingencies (Note 7) |
||||||||
Class A ordinary shares, $ |
||||||||
Shareholders’ Deficit: |
||||||||
Preference shares, $ or outstanding |
||||||||
Class B ordinary shares, $ |
||||||||
Additional paid-in capital |
||||||||
Accumulated deficit |
( |
) | ( |
) | ||||
|
|
|
|
|||||
Total Shareholders’ deficit |
( |
) | ( |
) | ||||
|
|
|
|
|||||
TOTAL LIABILITIES, REDEEMABLE ORDINARY SHARES AND SHAREHOLDERS’ DEFICIT |
$ |
$ |
||||||
|
|
|
|
For the Three Months Ended March 31, 2022 |
For the period from January 13, 2021 (inception) through March 31, 2021 |
|||||||
Formation and operating costs |
$ | $ | ||||||
Loss from operations |
( |
) |
( |
) | ||||
Other income (expense) |
||||||||
Interest income earned on cash and investments held in trust account |
||||||||
Offering costs allocated to warrants |
( |
) | ||||||
Change in fair value of derivative warrant liabilities |
( |
) | ||||||
Initial measurement of backstop derivative liabilit y |
( |
) |
||||||
Total other expense, net |
( |
) |
( |
) | ||||
Net loss |
$ |
( |
) |
$ |
( |
) | ||
Basic and diluted weighted average shares outstanding, Class A ordinary shares, subject to possible redemption |
||||||||
Basic and diluted net loss per ordinary share, Class A ordinary shares, subject to possible redemption |
$ | ( |
) | $ | ( |
) | ||
Basic and diluted weighted average shares outstanding, Class B ordinary shares |
||||||||
Basic and diluted net loss per ordinary share, Class B ordinary shares |
$ | ( |
) | $ | ( |
) | ||
Ordinary Shares |
Additional |
Accumulated |
Total Shareholders’ |
|||||||||||||||||||||||||
Class A |
Class B |
|||||||||||||||||||||||||||
Shares |
Amount |
Shares |
Amount |
Paid-In Capital |
Deficit |
Deficit |
||||||||||||||||||||||
Balance as of December 31, 2021 |
$ |
$ |
$ | $ |
( |
) |
$ |
( |
) | |||||||||||||||||||
Net loss |
— | — | — | — | ( |
) | ( |
) | ||||||||||||||||||||
|
|
|
|
|
|
|
|
|
|
|
|
|
|
|||||||||||||||
Balance as of March 31, 2022, (unaudited) |
$ |
$ |
$ |
( |
) | $ |
( |
) | ||||||||||||||||||||
|
|
|
|
|
|
|
|
|
|
|
|
|
|
Class A |
Class B |
Additional |
Total |
|||||||||||||||||||||||||
Ordinary Shares |
Ordinary Shares |
Paid-in |
Accumulated |
Shareholders’ |
||||||||||||||||||||||||
Shares |
Amount |
Shares |
Amount |
Capital |
Deficit |
Deficit |
||||||||||||||||||||||
B alance as of January 13, 2021 (inception) |
$ |
$ |
$ |
$ |
$ |
|||||||||||||||||||||||
Issuance of Class B Ordinary shares to Sponsor |
— |
— |
||||||||||||||||||||||||||
Accretion for Class A Ordinary Shares to redemption amount |
— |
|
— | — |
— |
( |
) | ( |
( |
) | ||||||||||||||||||
Net loss |
— | — |
— |
— |
( |
) | ( |
) | ||||||||||||||||||||
|
|
|
|
|
|
|
|
|
|
|
|
|
|
|||||||||||||||
Balance as of March 31, 2021, (unaudited) |
$ |
$ |
$ | $ |
( |
) | $ |
( |
) | |||||||||||||||||||
|
|
|
|
|
|
|
|
|
|
|
|
|
|
|
|
|
|
|
|
|
|
|
|
|
|
|
|
|
For the Three Months Ended March 31, 2022 |
For the period from January 13, 2021 (inception) through March 31, 2021 |
|||||||
Cash flows from operating activities: |
||||||||
Net loss |
$ | ( |
) | $ | ( |
) | ||
Adjustments to reconcile net loss to net cash used in operating activities: |
||||||||
Interest income on investments held in Trust Account |
( |
) | ( |
) | ||||
Offering costs allocated to derivative warrant liabilities |
||||||||
Change in fair value of derivative warrant liabilities |
( |
) | ||||||
Initial measurement of backstop derivative liability |
|
|
|
|
|
|
|
|
Changes in operating assets and liabilities: |
||||||||
Prepaid assets |
( |
) | ||||||
Accrued costs and expenses |
||||||||
Due to related party |
||||||||
|
|
|
|
|||||
Net cash used in operating activities |
( |
) |
( |
) | ||||
|
|
|
|
|||||
Cash flows from investing activity: |
||||||||
Investment of cash in Trust Account |
— | ( |
) | |||||
|
|
|
|
|||||
Net cash used in investing activity |
— |
( |
) | |||||
|
|
|
|
|||||
Cash flows from financing activities: |
||||||||
Proceeds from purchase of Class B shares by initial shareholder |
||||||||
Proceeds from initial public offering, net of underwriters’ discount |
||||||||
Proceeds from private placement |
||||||||
Payment of offering costs |
( |
) | ||||||
|
|
|
|
|||||
Net cash provided by financing activities |
— |
|||||||
|
|
|
|
|||||
Net change in cash |
( |
) | ||||||
Cash, beginning of the period |
||||||||
|
|
|
|
|||||
Cash, end of the period |
$ |
$ |
||||||
|
|
|
|
|||||
Supplemental disclosure of cash flow information: |
||||||||
Deferred underwriting commissions charged to temporary equity |
$ | $ | ||||||
|
|
|
|
• | Level 1, defined as observable inputs such as quoted prices (unadjusted) for identical instruments in active markets; |
• | Level 2, defined as inputs other than quoted prices in active markets that are either directly or indirectly observable such as quoted prices for similar instruments in active markets or quoted prices for identical or similar instruments in markets that are not active; and |
• | Level 3, defined as unobservable inputs in which little or no market data exists, therefore requiring an entity to develop its own assumptions, such as valuations derived from valuation techniques in which one or more significant inputs or significant value drivers are unobservable. |
For the three months ended March 31, 2022 |
For the period from January 13, 2021 (inception) through March 31, 2021 |
|||||||||||||||
Class A |
Class B |
Class A |
Class B |
|||||||||||||
Basic and diluted net loss per ordinary share: |
||||||||||||||||
Numerator: |
||||||||||||||||
Allocation of loss |
$ | ( |
) | $ | ( |
) | $ | ( |
) | $ | ( |
) | ||||
Denominator: |
||||||||||||||||
Weighted-average shares outstanding including shares subject to redemption |
||||||||||||||||
Basic and diluted loss per ordinary share |
$ | ( |
) | $ | ( |
) | $ | ( |
) | $ | ( |
) | ||||
Gross proceeds from IPO |
$ | |||
Less: |
||||
Proceeds allocated to Public Warrants |
( |
) | ||
Ordinary share issuance costs |
( |
) | ||
Plus: |
||||
Accretion of carrying value to redemption value |
||||
|
|
|||
Contingently redeemable ordinary shares |
$ |
|||
|
|
March 31, 2022 |
Quoted Prices In Active Markets (Level 1) |
Significant Other Observable Inputs (Level 2) |
Significant Other Unobservable Inputs (Level 3) |
|||||||||||||
Assets: |
||||||||||||||||
Mutual Fund held in Trust Account |
$ | $ | $ |
— |
$ |
— |
||||||||||
Liabilities: |
||||||||||||||||
Derivative warrant liability – Public Warrants |
$ | $ | $ |
— |
$ |
— |
||||||||||
Derivative warrant liability – Private Warrants |
— |
— |
||||||||||||||
Backstop derivative liability |
— |
— |
||||||||||||||
|
|
|
|
|
|
|
|
|||||||||
Derivative liabilities |
$ | $ | $ |
— |
$ | |||||||||||
|
|
|
|
|
|
|
|
December 31, 2021 |
Quoted Prices In Active Markets (Level 1) |
Significant Other Observable Inputs (Level 2) |
Significant Other Unobservable Inputs (Level 3) |
|||||||||||||
Assets: |
||||||||||||||||
Mutual Fund held in Trust Account |
$ | $ | $ |
— |
$ |
— |
||||||||||
Liabilities: |
||||||||||||||||
Derivative warrant liability – Public Warrants |
$ | $ | $ |
— |
$ |
— |
||||||||||
Derivative warrant liability – Private Warrants |
— |
— |
||||||||||||||
|
|
|
|
|
|
|
|
|||||||||
Derivative warrant liabilities |
$ | $ | $ |
— |
$ | |||||||||||
|
|
|
|
|
|
|
|
Private Placement Warrants |
Public Warrants |
Warrant Liabilities |
||||||||||
Derivative warrant liability – initial measurement on March 25, 2021 |
$ |
$ |
$ |
|||||||||
Change in fair value of derivative warrant liabilities |
||||||||||||
|
|
|
|
|
|
|||||||
Derivative warrant liabilities at March 31, 2021 |
$ |
$ |
$ |
|||||||||
|
|
|
|
|
|
Private Placement Warrants |
Public Warrants |
Warrant Liabilities |
||||||||||
Derivative warrant liabilities at December 31, 2021 |
$ |
$ |
— |
$ |
||||||||
Change in fair value of derivative warrant liabilities |
( |
) |
— |
( |
) | |||||||
|
|
|
|
|
|
|||||||
Derivative warrant liabilities at March 31, 2022 |
$ |
$ |
— |
$ |
||||||||
|
|
|
|
|
|
March 31, 2022 |
December 31, 2021 |
|||||||
Strike price |
$ | $ | ||||||
Share price |
$ | $ | ||||||
Volatility |
% | % | ||||||
Risk-free rate |
% | % | ||||||
Expected term (years) |
Share price |
$ | |||
Volatility |
% | |||
Risk-free rate |
% | |||
Minimum Redemption Percentage |
% | |||
Maximum Redemption Percentage |
% |
• | in whole and not in part; |
• | at a price of $ |
• | upon not less than “30-day redemption period”) to each warrant holder; and |
• | if, and only if, the reported closing price of the Class A ordinary shares equals or exceeds $ |
redemption trigger price will be adjusted (to the nearest cent) to be equal to 180% of the higher of the Market Value and the Newly Issued Price. |
December 31, |
||||||||
2020 |
2021 |
|||||||
Assets |
||||||||
Current assets: |
||||||||
Cash and cash equivalents |
$ | $ | ||||||
Inventory, net |
||||||||
Prepaid expenses and other current assets |
||||||||
|
|
|
|
|||||
Total current assets |
||||||||
Property and equipment, net |
||||||||
Operating lease right-of-use |
||||||||
Other long-term assets |
||||||||
|
|
|
|
|||||
Total assets |
$ | $ | ||||||
|
|
|
|
|||||
Liabilities, Convertible Preferred Stock and Stockholders’ Deficit |
||||||||
Current liabilities: |
||||||||
Accounts payable |
$ | $ | ||||||
Accrued expenses |
||||||||
Deferred revenue |
||||||||
Operating lease liabilities, current |
||||||||
Other current liabilities |
||||||||
Debt, current |
||||||||
|
|
|
|
|||||
Total current liabilities |
||||||||
Debt, noncurrent |
||||||||
Operating lease liabilities, noncurrent |
||||||||
Other long-term liabilities |
||||||||
|
|
|
|
|||||
Total liabilities |
||||||||
|
|
|
|
|||||
Commitments and contingencies (Note 8) |
||||||||
Convertible preferred stock, $ |
||||||||
Stockholders’ deficit: |
||||||||
Common stock, $ |
||||||||
Additional paid-in capital |
||||||||
Accumulated deficit |
( |
) | ( |
) | ||||
|
|
|
|
|||||
Total stockholders’ deficit |
( |
) | ( |
) | ||||
|
|
|
|
|||||
Total liabilities, convertible preferred stock and stockholders’ deficit |
$ | $ | ||||||
|
|
|
|
Year Ended December 31, |
||||||||||||
2019 |
2020 |
2021 |
||||||||||
Revenue, net |
$ | $ | $ | |||||||||
Cost of goods sold |
||||||||||||
|
|
|
|
|
|
|||||||
Gross profit |
||||||||||||
Operating expenses: |
||||||||||||
Advertising |
||||||||||||
Product development |
||||||||||||
Selling, general and administrative |
||||||||||||
|
|
|
|
|
|
|||||||
Operating loss |
( |
) | ( |
) | ( |
) | ||||||
Interest expense |
||||||||||||
Loss on extinguishment of debt |
||||||||||||
Other expense (income), net |
( |
) | ||||||||||
|
|
|
|
|
|
|||||||
Interest and other expense (income), net |
( |
) | ||||||||||
|
|
|
|
|
|
|||||||
Loss before provision for income taxes |
( |
) | ( |
) | ( |
) | ||||||
Provision for income taxes |
||||||||||||
|
|
|
|
|
|
|||||||
Net loss |
$ | ( |
) | $ | ( |
) | $ | ( |
) | |||
Deemed dividend due to the exchange of Series Seed convertible preferred stock and Series A convertible preferred stock for Series D convertible preferred stock (Note 9) |
( |
) | ||||||||||
|
|
|
|
|
|
|||||||
Net loss attributable to common stockholders, basic and diluted |
$ | ( |
) | $ | ( |
) | $ | ( |
) | |||
|
|
|
|
|
|
|||||||
Net loss per share attributable to common stockholders, basic and diluted |
$ | ( |
) | $ | ( |
) | $ | ( |
) | |||
|
|
|
|
|
|
|||||||
Weighted-average shares used in computing net loss per share attributable to common stockholders, basic and diluted |
||||||||||||
|
|
|
|
|
|
Convertible Preferred Stock |
Common Stock |
Additional Paid-In Capital |
Accumulated Deficit |
Total Stockholders’ Deficit |
||||||||||||||||||||||||||||
Shares |
Amount |
Shares |
Amount |
|||||||||||||||||||||||||||||
Balance at December 31, 2018 |
$ | $ | $ | $ | ( |
) | $ | ( |
) | |||||||||||||||||||||||
Issuance of Series D convertible preferred stock, net of issuance costs of $ |
— | — | — | — | — | |||||||||||||||||||||||||||
Issuance of Series D-1 convertible preferred stock, net of issuance costs of $ |
— | — | — | — | — | |||||||||||||||||||||||||||
Exchange of common stock, Series Seed convertible preferred stock and Series A convertible preferred stock for Series D convertible preferred stock, inclusive of deemed dividend of $ |
( |
) | — | ( |
) | ( |
) | ( |
) | |||||||||||||||||||||||
Exchange of common stock for Series D convertible preferred stock, inclusive of stock-based compensation of $ |
( |
) | — | — | — | — | ||||||||||||||||||||||||||
Issuance of common stock for business and asset acquisitions |
— | — | — | — | ||||||||||||||||||||||||||||
Issuance of common stock upon exercise of stock options |
— | — | — | — | ||||||||||||||||||||||||||||
Vesting of early exercise of options |
— | — | — | — | — | |||||||||||||||||||||||||||
Stock-based compensation associated with stock options |
— | — | — | — | — | |||||||||||||||||||||||||||
Net loss |
— | — | — | — | — | ( |
) | ( |
) | |||||||||||||||||||||||
|
|
|
|
|
|
|
|
|
|
|
|
|
|
|||||||||||||||||||
Balance at December 31, 2019 |
( |
) | ( |
) | ||||||||||||||||||||||||||||
Issuance of Series D-2 convertible preferred stock, net of issuance costs of $ |
— | — | — | — | — | |||||||||||||||||||||||||||
Issuance of Series E convertible preferred stock, net of issuance costs of $ |
— | — | — | — | — | |||||||||||||||||||||||||||
Issuance of common stock for an asset acquisition |
— | — | — | — | ||||||||||||||||||||||||||||
Issuance of common stock upon exercise of stock options, net of amount related to early exercised options of $ |
— | — | — | |||||||||||||||||||||||||||||
Vesting of early exercise of options |
— | — | — | — | — | |||||||||||||||||||||||||||
Stock-based compensation |
— | — | — | — | — | |||||||||||||||||||||||||||
Net loss |
— | — | — | — | — | ( |
) | ( |
) | |||||||||||||||||||||||
|
|
|
|
|
|
|
|
|
|
|
|
|
|
|||||||||||||||||||
Balance at December 31, 2020 |
$ | $ | $ | $ | ( |
) | $ | ( |
) | |||||||||||||||||||||||
Issuance of common stock for services |
— | — | — | — | ||||||||||||||||||||||||||||
Issuance of common stock warrants |
— | — | — | — | — | |||||||||||||||||||||||||||
Issuance of common stock upon exercise of warrants |
— | — | — | — | ||||||||||||||||||||||||||||
Issuance of common stock upon exercise of stock options, net of amount related to early exercised options of $ |
— | — | — | — | ||||||||||||||||||||||||||||
Vesting of early exercise of options |
— | — | — | — | — | |||||||||||||||||||||||||||
Repurchase of early exercised options |
— | — | ( |
) | — | — | — | — | ||||||||||||||||||||||||
Stock-based compensation |
— | — | — | — | — | |||||||||||||||||||||||||||
Net loss |
— | — | — | — | — | ( |
) | ( |
) | |||||||||||||||||||||||
|
|
|
|
|
|
|
|
|
|
|
|
|
|
|||||||||||||||||||
Balance at December 31, 2021 |
$ | $ | $ | $ | ( |
) | $ | ( |
) | |||||||||||||||||||||||
|
|
|
|
|
|
|
|
|
|
|
|
|
|
Year Ended December 31, |
||||||||||||
2019 |
2020 |
2021 |
||||||||||
Cash Flows from Operating Activities |
||||||||||||
Net loss |
$ | ( |
) | $ | ( |
) | $ | ( |
) | |||
Adjustments to reconcile net loss to net cash used in operating activities: |
||||||||||||
Remeasurement of convertible preferred stock warrant liability |
||||||||||||
Stock-based compensation |
||||||||||||
Depreciation and amortization |
||||||||||||
Non-cash interest expense |
||||||||||||
Gain on purchase of a business |
( |
) | ||||||||||
Inventory reserve |
||||||||||||
Loss on extinguishment of debt |
||||||||||||
Other non-cash expenses |
||||||||||||
Changes in operating assets and liabilities: |
||||||||||||
Inventory |
( |
) | ( |
) | ( |
) | ||||||
Prepaids and other assets |
( |
) | ( |
) | ( |
) | ||||||
Accounts payable |
( |
) | ( |
) | ||||||||
Accrued expenses |
( |
) | ( |
) | ||||||||
Deferred revenue |
||||||||||||
Operating lease right-of-use |
||||||||||||
Other liabilities |
( |
) | ||||||||||
|
|
|
|
|
|
|||||||
Net cash used in operating activities |
( |
) | ( |
) | ( |
) | ||||||
|
|
|
|
|
|
|||||||
Cash Flows from Investing Activities |
||||||||||||
Purchase of investments |
( |
) | ||||||||||
Proceeds from maturities of investments |
||||||||||||
Purchase of property and equipment |
( |
) | ( |
) | ( |
) | ||||||
Purchase of intangible assets |
( |
) | ||||||||||
Acquisition of a business |
( |
) | ||||||||||
|
|
|
|
|
|
|||||||
Net cash used in investing activities |
( |
) | ( |
) | ( |
) | ||||||
|
|
|
|
|
|
|||||||
Cash Flows from Financing Activities |
||||||||||||
Proceeds from issuance of convertible preferred stock, net of issuance costs |
||||||||||||
Payment of deferred offering and convertible preferred stock issuance costs |
( |
) | ||||||||||
Proceeds from issuance of debt |
||||||||||||
Repayment of debt |
( |
) | ( |
) | ( |
) | ||||||
Payment of debt extinguishment |
( |
) | ||||||||||
Payment of debt issuance costs |
( |
) | ( |
) | ( |
) | ||||||
Proceeds from exercise of stock options and warrants |
||||||||||||
Repurchase of common stock |
( |
) | ||||||||||
|
|
|
|
|
|
|||||||
Net cash provided by financing activities |
||||||||||||
|
|
|
|
|
|
|||||||
Net increase (decrease) in cash and cash equivalents |
( |
) | ( |
) | ||||||||
Cash and cash equivalents at beginning of year |
||||||||||||
|
|
|
|
|
|
|||||||
Cash and cash equivalents at end of year |
$ | $ | $ | |||||||||
|
|
|
|
|
|
Year Ended December 31, |
||||||||||||
2019 |
2020 |
2021 |
||||||||||
Supplemental Disclosure |
||||||||||||
Cash paid for income taxes |
$ | $ |
$ |
|||||||||
Cash paid for interest |
||||||||||||
Supplemental Disclosure of Non-Cash Investing and Financing Activities |
||||||||||||
Purchases of property and equipment included in accounts payable and accrued liabilities |
$ |
$ |
$ |
|||||||||
Issuance of common stock for business and asset acquisitions |
— | |||||||||||
Deferred offering and convertible preferred stock issuance costs included in accounts payable and accrued liabilities |
— |
|||||||||||
Debt issuance costs recorded with an offset to convertible preferred stock warrant liability |
— |
|||||||||||
Initial measurement of common stock warrants recorded as debt issuance costs |
— |
— |
||||||||||
Vesting of early exercised stock options |
1. |
Description of Business |
2. |
Summary of Significant Accounting Policies |
Computer equipment |
||||
Furniture and fixtures |
||||
Machinery and warehouse equipment |
||||
Leasehold improvements |
|
or lease term |
|
Year Ended December 31, |
||||||||||||
2019 |
2020 |
2021 |
||||||||||
Revenue, net: |
||||||||||||
Grove Brands |
$ | $ | $ | |||||||||
Third-party products |
||||||||||||
|
|
|
|
|
|
|||||||
Total revenue, net |
$ | $ | $ | |||||||||
|
|
|
|
|
|
3. |
Fair Value Measurements and Fair Value of Financial Instruments |
December 31, 2020 |
||||||||||||||||
Level 1 |
Level 2 |
Level 3 |
Total |
|||||||||||||
Financial Assets: |
||||||||||||||||
Cash equivalents: |
||||||||||||||||
Money market funds |
$ | $ | $ | $ | ||||||||||||
|
|
|
|
|
|
|
|
|||||||||
Total |
$ | $ | $ | $ | ||||||||||||
|
|
|
|
|
|
|
|
|||||||||
Financial Liabilities: |
||||||||||||||||
Convertible preferred stock warrant liability |
$ | $ | $ | $ | ||||||||||||
|
|
|
|
|
|
|
|
|||||||||
Total |
$ | $ | $ | $ | ||||||||||||
|
|
|
|
|
|
|
|
December 31, 2021 |
||||||||||||||||
Level 1 |
Level 2 |
Level 3 |
Total |
|||||||||||||
Financial Assets: |
||||||||||||||||
Cash equivalents: |
||||||||||||||||
Money market funds |
$ | $ | $ | $ | ||||||||||||
|
|
|
|
|
|
|
|
|||||||||
Total |
$ | $ | $ | $ | ||||||||||||
|
|
|
|
|
|
|
|
|||||||||
Financial Liabilities: |
||||||||||||||||
Convertible preferred stock warrant liability |
$ | $ | $ | $ | ||||||||||||
|
|
|
|
|
|
|
|
|||||||||
Total |
$ | $ | $ | $ | ||||||||||||
|
|
|
|
|
|
|
|
Balance at December 31, 2020 |
$ | |
||
Change in fair value |
||||
|
|
|||
Balance at December 31, 2021 |
$ | |||
|
|
December 31, 2020 |
||||||||||||||||
Series A Convertible Preferred Stock Warrants |
Series B Convertible Preferred Stock Warrants |
Series C Convertible Preferred Stock Warrants |
Series D Convertible Preferred Stock Warrants |
|||||||||||||
Expected term (in years) |
||||||||||||||||
Fair value of underlying shares |
||||||||||||||||
Volatility |
% | % | % | % | ||||||||||||
Risk-free interest rate |
% | % | % | % | ||||||||||||
Dividend yield |
December 31, 2021 |
||||||||||||||||
Series A Convertible Preferred Stock Warrants |
Series B Convertible Preferred Stock Warrants |
Series C Convertible Preferred Stock Warrants |
Series D Convertible Preferred Stock Warrants |
|||||||||||||
Expected term (in years) |
||||||||||||||||
Fair value of underlying shares |
||||||||||||||||
Volatility |
% | % | % | % | ||||||||||||
Risk-free interest rate |
% | % | % | % | ||||||||||||
Dividend yield |
4. |
Other Financial Statement Information |
December 31, |
||||||||
2020 |
2021 |
|||||||
Machinery and warehouse equipment |
$ | $ | ||||||
Internally developed software |
||||||||
Computer equipment |
||||||||
Leasehold improvements hold Improvements |
||||||||
Furniture and fixtures |
||||||||
Construction in progress |
||||||||
|
|
|
|
|||||
Total property and equipment |
||||||||
Less: accumulated depreciation |
( |
) | ( |
) | ||||
|
|
|
|
|||||
Property and equipment, net |
$ | $ | ||||||
|
|
|
|
December 31, |
||||||||
2020 |
2021 |
|||||||
Inventory purchases |
$ | $ | ||||||
Advertising costs |
||||||||
Compensation and benefits |
||||||||
Sales taxes |
||||||||
Fulfillment costs |
||||||||
Other accrued expenses |
||||||||
|
|
|
|
|||||
Total accrued expenses |
$ | $ | ||||||
|
|
|
|
5. |
Business Combination |
6. |
Debt and Convertible Preferred Stock Warrants |
December 31, |
||||||||
2020 |
2021 |
|||||||
Silicon Valley Bank Loan Revolver |
$ | $ | ||||||
Silicon Valley Bank Term Loan |
||||||||
Silicon Valley Bank and Hercules Mezzanine Term Loan |
||||||||
Triplepoint Loan Facility 4 |
||||||||
Atel Loan Facility Draw 1 |
||||||||
Atel Loan Facility Draw 2 |
||||||||
Atel Loan Facility Draw 3 |
||||||||
Atel Loan Facility Draw 4 |
||||||||
|
|
|
|
|||||
Total debt |
||||||||
Less: debt, current |
( |
) | ( |
) | ||||
|
|
|
|
|||||
Total debt, noncurrent |
$ | $ | ||||||
|
|
|
|
Year Ended December 31, |
||||
2022 |
$ | |||
2023 |
||||
2024 |
||||
2025 |
||||
2026 |
||||
Thereafter |
||||
|
|
|||
Total principal debt payments |
||||
Less: debt discount |
( |
) | ||
|
|
|||
Total debt |
$ | |||
|
|
December 31, 2021 | ||||||||||||||
Lenders |
Exercise Price Per Share |
Number of Shares |
Expiration Date | |||||||||||
Series A warrants |
SVB | $ | ||||||||||||
Series B warrants |
SVB | |||||||||||||
Series C warrants |
TriplePoint | |||||||||||||
Series D warrants |
TriplePoint |
7. |
Leases |
Year Ended December 31, |
Operating Lease |
|||
2022 |
$ | |||
2023 |
||||
2024 |
||||
2025 |
||||
2026 |
||||
Thereafter |
||||
Total undiscounted lease payments |
||||
Less: Imputed interest |
( |
) | ||
Present value of lease liabilities |
||||
Less: Operating lease liabilities, current |
||||
Operating lease liabilities, noncurrent |
$ | |||
8. |
Commitments and Contingencies |
9. |
Convertible Preferred Stock |
Original Issue Price |
Shares Authorized |
Shares Outstanding |
Net Carrying Value |
Liquidation Preference |
||||||||||||||||
Series Seed |
$ | $ | $ | |||||||||||||||||
Series A |
||||||||||||||||||||
Series B |
||||||||||||||||||||
Series C |
||||||||||||||||||||
Series C-1 |
||||||||||||||||||||
Series D |
||||||||||||||||||||
Series D-1 |
||||||||||||||||||||
Series D-2 |
||||||||||||||||||||
Series E |
||||||||||||||||||||
Total |
$ | $ | ||||||||||||||||||
10. |
Stock-Based Compensation |
Options Outstanding |
||||||||||||||||
Number of Options |
Weighted– Average Exercise Price |
Weighted- Average Remaining Contractual Life (years) |
Aggregate Intrinsic Value |
|||||||||||||
Balance – December 31, 2020 |
$ | $ | ||||||||||||||
Granted |
||||||||||||||||
Exercised |
( |
) | ||||||||||||||
Forfeited and expired |
( |
) | ||||||||||||||
|
|
|||||||||||||||
Balance – December 31, 2021 |
$ | |||||||||||||||
|
|
|||||||||||||||
Options vested and exercisable – December 31, 2021 |
$ | $ | ||||||||||||||
|
|
Number of Options |
Weighted– Average Exercise Price |
|||||||
Outstanding and unvested as of December 31, 2020 |
$ | |||||||
Issued |
||||||||
Vested |
( |
) | ||||||
Repurchased |
( |
) | ||||||
|
|
|||||||
Outstanding and unvested as of December 31, 2021 |
$ | |||||||
|
|
Year Ended December 31, | ||||||
2019 |
2020 |
2021 | ||||
Fair value of common stock |
$ |
$ |
$ | |||
Expected term (in years) |
||||||
Volatility |
||||||
Risk-free interest rate |
||||||
Dividend yield |
— % | — % | — % |
11. |
Provision for Income Taxes |
Years Ended December 31, |
||||||||||||
2019 |
2020 |
2021 |
||||||||||
Federal statutory rate |
% | % | % | |||||||||
Change in valuation allowance |
( |
)% | ( |
)% | ( |
)% | ||||||
Stock-based compensation |
( |
)% | ( |
)% | ( |
)% | ||||||
Other |
( |
)% | ( |
)% | ( |
)% | ||||||
|
|
|
|
|
|
|||||||
Provision for income taxes |
% | % | % | |||||||||
|
|
|
|
|
|
December 31, |
||||||||
2020 |
2021 |
|||||||
Deferred tax assets: |
||||||||
Net operating loss carryforwards |
$ | $ | ||||||
Deferred revenue |
||||||||
Inventory reserve and uniform capitalization |
||||||||
Operating lease liabilities |
||||||||
Accruals and other reserves |
||||||||
Stock-based compensation |
||||||||
Other |
||||||||
|
|
|
|
|||||
Total deferred tax assets |
||||||||
Less: valuation allowance |
||||||||
|
|
|
|
|||||
Total deferred tax assets, net of valuation allowance |
||||||||
|
|
|
|
|||||
Deferred tax liabilities: |
||||||||
Operating lease right-of-use |
( |
) | ( |
) | ||||
Depreciation and amortization |
( |
) | ( |
) | ||||
|
|
|
|
|||||
Total deferred tax liabilities |
( |
) | ( |
) | ||||
|
|
|
|
|||||
Net deferred tax assets |
$ | $ | ||||||
|
|
|
|
December 31, |
||||||||
2020 |
2021 |
|||||||
Valuation allowance, as of beginning of year |
$ | $ | ||||||
Valuation allowance established |
||||||||
Changes to existing valuation allowances |
( |
) | ( |
) | ||||
|
|
|
|
|||||
Valuation allowance, as of end of year |
$ | $ | ||||||
|
|
|
|
December 31, |
||||||||
2020 |
2021 |
|||||||
Balance at beginning of year |
$ | $ | ||||||
Decrease related to prior period tax positions |
( |
) | ||||||
Increase related to current year tax positions |
||||||||
|
|
|
|
|||||
Balance at end of year |
$ | $ | ||||||
|
|
|
|
12. |
Net Loss Per Share Attributable to Common Stockholders |
Year Ended December 31, |
||||||||||||
2019 |
2020 |
2021 |
||||||||||
Convertible preferred stock |
||||||||||||
Common stock options |
||||||||||||
Restricted stock units |
||||||||||||
Convertible preferred stock warrants |
||||||||||||
Common stock warrants |
||||||||||||
Shares subject to repurchase |
||||||||||||
|
|
|
|
|
|
|||||||
Total |
||||||||||||
|
|
|
|
|
|
13. |
Subsequent Events |
December 31, |
March 31, |
|||||||
2021 |
2022 |
|||||||
(Unaudited) | ||||||||
Assets |
||||||||
Current assets: |
||||||||
Cash and cash equivalents |
$ | $ | ||||||
Inventory, net |
||||||||
Prepaid expenses and other current assets |
||||||||
|
|
|
|
|||||
Total current assets |
||||||||
Property and equipment, net |
||||||||
Operating lease right-of-use |
||||||||
Other long-term assets |
||||||||
|
|
|
|
|||||
Total assets |
$ | $ | ||||||
|
|
|
|
|||||
Liabilities, Convertible Preferred Stock, Contingently Redeemable Convertible Common Stock and Stockholders’ Deficit |
||||||||
Current liabilities: |
||||||||
Accounts payable |
$ | $ | ||||||
Accrued expenses |
||||||||
Deferred revenue |
||||||||
Operating lease liabilities, current |
||||||||
Other current liabilities |
||||||||
Debt, current |
||||||||
|
|
|
|
|||||
Total current liabilities |
||||||||
Debt, noncurrent |
||||||||
Operating lease liabilities, noncurrent |
||||||||
Other long-term liabilities |
||||||||
|
|
|
|
|||||
Total liabilities |
||||||||
|
|
|
|
|||||
Commitments and contingencies (Note 6) |
||||||||
Convertible preferred stock, $ |
||||||||
Contingently redeemable convertible common stock – |
||||||||
Stockholders’ deficit: |
||||||||
Common stock, $ |
||||||||
Additional paid-in capital |
||||||||
Accumulated deficit |
( |
) | ( |
) | ||||
|
|
|
|
|||||
Total stockholders’ deficit |
( |
) | ( |
) | ||||
|
|
|
|
|||||
Total liabilities, convertible preferred stock, contingently redeemable convertible common stock and stockholders’ deficit |
$ | $ | ||||||
|
|
|
|
Three Months Ended March 31, |
||||||||
2021 |
2022 |
|||||||
Revenue, net |
$ | $ | ||||||
Cost of goods sold |
||||||||
|
|
|
|
|||||
Gross profit |
||||||||
|
|
|
|
|||||
Operating expenses: |
||||||||
Advertising |
||||||||
Product development |
||||||||
Selling, general and administrative |
||||||||
|
|
|
|
|||||
Operating loss |
( |
) | ( |
) | ||||
Interest expense |
||||||||
Other expense (income), net |
( |
) | ||||||
|
|
|
|
|||||
Interest and other expense, net |
||||||||
|
|
|
|
|||||
Loss before provision for income taxes |
( |
) | ( |
) | ||||
Provision for income taxes |
||||||||
|
|
|
|
|||||
Net loss |
$ | ( |
) | $ | ( |
) | ||
|
|
|
|
|||||
Net loss per share attributable to common stockholders, basic and diluted |
$ | ( |
) | $ | ( |
) | ||
|
|
|
|
|||||
Weighted-average shares used in computing net loss per share attributable to common stockholders, basic and diluted |
||||||||
|
|
|
|
Convertible Preferred Stock |
Common Stock |
Additional Paid-In Capital |
Accumulated Deficit |
Total Stockholders’ Deficit |
||||||||||||||||||||||||||
Shares |
Amount |
Shares |
Amount |
|||||||||||||||||||||||||||
Balance at December 31, 2020 |
$ | $ | $ | $ | ( |
) | $ | ( |
) | |||||||||||||||||||||
Issuance of common stock upon exercise of stock options |
— | — | — | — | ||||||||||||||||||||||||||
Vesting of early exercise of options |
— | — | — | — | — | |||||||||||||||||||||||||
Repurchase of early exercised options |
— | — | ( |
) | — | — | — | — | ||||||||||||||||||||||
Stock-based compensation |
— | — | — | — | — | |||||||||||||||||||||||||
Net loss |
— | — | — | — | — | ( |
) | ( |
) | |||||||||||||||||||||
|
|
|
|
|
|
|
|
|
|
|
|
|
|
|||||||||||||||||
Balance at March 31, 2021 (Unaudited) |
$ | $ | $ | $ | ( |
) | $ | ( |
) | |||||||||||||||||||||
|
|
|
|
|
|
|
|
|
|
|
|
|
|
Convertible Preferred Stock |
Contingently Redeemable Convertible Common Stock |
Common Stock |
Additional Paid-In Capital |
Accumulated Deficit |
Total Stockholders’ Deficit |
|||||||||||||||||||||||||||||||||
Shares |
Amount |
Shares |
Amount |
Shares |
Amount |
|||||||||||||||||||||||||||||||||
Balance at December 31, 2021 |
$ | $ | $ | $ | $ | ( |
) | $ | ( |
) | ||||||||||||||||||||||||||||
Issuance of common stock upon exercise of stock options |
— | — | — | — | — | — | ||||||||||||||||||||||||||||||||
Issuance of contingently redeemable convertible common stock, net of issuance costs of $ |
— | — | — | — | — | — | ||||||||||||||||||||||||||||||||
Vesting of early exercise of options |
— | — | — | — | — | — | — | |||||||||||||||||||||||||||||||
Stock-based compensation |
— | — | — | — | — | — | — | |||||||||||||||||||||||||||||||
Net loss |
— | — | — | — | — | — | — | ( |
) | ( |
) | |||||||||||||||||||||||||||
|
|
|
|
|
|
|
|
|
|
|
|
|
|
|
|
|
|
|||||||||||||||||||||
Balance at March 31, 2022 (Unaudited) |
$ | $ | $ | $ | $ | ( |
) | $ | ( |
) | ||||||||||||||||||||||||||||
|
|
|
|
|
|
|
|
|
|
|
|
|
|
|
|
|
|
Three Months Ended March 31, |
||||||||
2021 |
2022 |
|||||||
Cash Flows from Operating Activities |
||||||||
Net loss |
$ | ( |
) | $ | ( |
) | ||
Adjustments to reconcile net loss to net cash used in operating activities: |
||||||||
Remeasurement of convertible preferred stock warrant liability |
( |
) | ||||||
Stock-based compensation |
||||||||
Depreciation and amortization |
||||||||
Non-cash interest expense |
||||||||
Inventory reserve |
||||||||
Other non-cash expenses |
||||||||
Changes in operating assets and liabilities: |
||||||||
Inventory |
( |
) | ||||||
Prepaids and other assets |
( |
) | ( |
) | ||||
Accounts payable |
||||||||
Accrued expenses |
||||||||
Deferred revenue |
||||||||
Operating lease right-of-use |
( |
) | ||||||
Other liabilities |
( |
) | ||||||
|
|
|
|
|||||
Net cash used in operating activities |
( |
) | ( |
) | ||||
|
|
|
|
|||||
Cash Flows from Investing Activities |
||||||||
Purchase of property and equipment |
( |
) | ( |
) | ||||
|
|
|
|
|||||
Net cash used in investing activities |
( |
) | ( |
) | ||||
|
|
|
|
|||||
Cash Flows from Financing Activities |
||||||||
Proceeds from issuance of contingently redeemable convertible common stock |
||||||||
Payment of deferred offering and convertible preferred stock issuance costs |
( |
) | ( |
) | ||||
Repayment of debt |
( |
) | ( |
) | ||||
Proceeds from exercise of stock options |
||||||||
Repurchase of common stock |
( |
) | ||||||
|
|
|
|
|||||
Net cash provided (used in) by financing activities |
( |
) | ||||||
|
|
|
|
|||||
Net decrease in cash and cash equivalents |
( |
) | ( |
) | ||||
Cash and cash equivalents at beginning of period |
||||||||
|
|
|
|
|||||
Cash and cash equivalents at end of period |
$ | $ | ||||||
|
|
|
|
|||||
Supplemental Disclosure |
||||||||
Cash paid for taxes |
$ | $ | ||||||
Cash paid for interest |
||||||||
Supplemental Disclosure of Non-Cash Investing and Financing Activities |
||||||||
Purchases of property and equipment included in accounts payable and accrued liabilities |
$ | $ | ||||||
Deferred offering, convertible preferred stock and contingently redeemable convertible common stock issuance costs included in accounts payable and accrued liabilities |
||||||||
Vesting of early exercised stock options |
1. |
Description of Business |
2. |
Summary of Significant Accounting Policies |
Three Months Ended March 31, |
||||||||
2021 |
2022 |
|||||||
Revenue, net: |
||||||||
Grove Brands |
$ | $ | ||||||
Third-party products |
||||||||
|
|
|
|
|||||
Total revenue, net |
$ | $ | ||||||
|
|
|
|
3. |
Fair Value Measurements and Fair Value of Financial Instruments |
December 31, 2021 |
||||||||||||||||
Level 1 |
Level 2 |
Level 3 |
Total |
|||||||||||||
Financial Assets: |
||||||||||||||||
Cash equivalents: |
||||||||||||||||
Money market funds |
$ | $ | $ | $ | ||||||||||||
|
|
|
|
|
|
|
|
|||||||||
Total |
$ | $ | $ | $ | ||||||||||||
|
|
|
|
|
|
|
|
|||||||||
Financial Liabilities: |
||||||||||||||||
Convertible preferred stock warrant liability |
$ | $ | $ | $ | ||||||||||||
|
|
|
|
|
|
|
|
|||||||||
Total |
$ | $ | $ | $ | ||||||||||||
|
|
|
|
|
|
|
|
|||||||||
March 31, 2022 |
||||||||||||||||
Level 1 |
Level 2 |
Level 3 |
Total |
|||||||||||||
Financial Assets: |
||||||||||||||||
Cash equivalents: |
||||||||||||||||
Money market funds |
$ | $ | $ | $ | ||||||||||||
|
|
|
|
|
|
|
|
|||||||||
Total |
$ | $ | $ | $ | ||||||||||||
|
|
|
|
|
|
|
|
|||||||||
Financial Liabilities: |
||||||||||||||||
Convertible preferred stock warrant liability |
$ | $ | $ | $ | ||||||||||||
|
|
|
|
|
|
|
|
|||||||||
Total |
$ | $ | $ | $ | ||||||||||||
|
|
|
|
|
|
|
|
Balance at December 31, 2021 |
$ | |||
Change in fair value |
( |
) | ||
|
|
|||
Balance at March 31, 2022 |
$ | |||
|
|
December 31, 2021 |
||||||||||||||||
Series A Convertible Preferred Stock Warrants |
Series B Convertible Preferred Stock Warrants |
Series C Convertible Preferred Stock Warrants |
Series D Convertible Preferred Stock Warrants |
|||||||||||||
Expected term (in years) |
||||||||||||||||
Fair value of underlying shares |
||||||||||||||||
Volatility |
% | % | % | % | ||||||||||||
Risk-free interest rate |
% | % | % | % | ||||||||||||
Dividend yield |
||||||||||||||||
March 31, 2022 |
||||||||||||||||
Series A Convertible Preferred Stock Warrants |
Series B Convertible Preferred Stock Warrants |
Series C Convertible Preferred Stock Warrants |
Series D Convertible Preferred Stock Warrants |
|||||||||||||
Expected term (in years) |
||||||||||||||||
Fair value of underlying shares |
||||||||||||||||
Volatility |
% | % | % | % | ||||||||||||
Risk-free interest rate |
% | % | % | % | ||||||||||||
Dividend yield |
4. |
Accrued Expenses |
December 31, |
March 31, |
|||||||
2021 |
2022 |
|||||||
Inventory purchases |
$ | $ | ||||||
Compensation and benefits |
||||||||
Advertising costs |
||||||||
Fulfillment costs |
||||||||
Sales taxes |
||||||||
Other accrued expenses |
||||||||
|
|
|
|
|||||
Total accrued expenses |
$ | $ | ||||||
|
|
|
|
5. |
Debt and Convertible Preferred Stock and Common Stock Warrants |
December 31, |
March 31, |
|||||||
2021 |
2022 |
|||||||
Silicon Valley Bank Loan Revolver |
$ | $ | ||||||
Silicon Valley Bank and Hercules Mezzanine Term Loan |
||||||||
Atel Loan Facility Draw 3 |
||||||||
Atel Loan Facility Draw 4 |
||||||||
|
|
|
|
|||||
Total debt |
||||||||
Less: debt, current |
( |
) | ( |
) | ||||
|
|
|
|
|||||
Total debt, noncurrent |
$ | $ | ||||||
|
|
|
|
March 31, 2022 | ||||||||||||
Lenders |
Exercise Price Per Share |
Number of Shares |
Expiration Date | |||||||||
Series A warrants |
SVB | $ | ||||||||||
Series B warrants |
SVB | |||||||||||
Series C warrants |
TriplePoint | |||||||||||
Series D warrants |
TriplePoint |
6. |
Commitments and Contingencies |
7. |
Convertible Preferred Stock |
Original Issue Price |
Shares Authorized |
Shares Outstanding |
Net Carrying Value |
Liquidation Preference |
||||||||||||||||
Series Seed |
$ | $ | $ | |||||||||||||||||
Series A |
||||||||||||||||||||
Series B |
||||||||||||||||||||
Series C |
||||||||||||||||||||
Series C-1 |
||||||||||||||||||||
Series D |
||||||||||||||||||||
Series D-1 |
||||||||||||||||||||
Series D-2 |
||||||||||||||||||||
Series E |
||||||||||||||||||||
|
|
|
|
|
|
|
|
|||||||||||||
Total |
$ | $ | ||||||||||||||||||
|
|
|
|
|
|
|
|
8. |
Backstop Funding Agreement and Contingently Redeemable Convertible Common Stock |
9. |
Stock-Based Compensation |
Options Outstanding |
||||||||||||||||
Number of Options |
Weighted– Average Exercise Price |
Weighted- Average Remaining Contractual Life (years) |
Aggregate Intrinsic Value |
|||||||||||||
Balance – December 31, 2021 |
$ | $ | ||||||||||||||
Exercised |
( |
) | $ | |||||||||||||
Forfeited and expired |
( |
) | $ | |||||||||||||
|
|
|||||||||||||||
Balance – March 31, 2022 |
$ | $ | ||||||||||||||
|
|
|||||||||||||||
Options vested and exercisable – March 31, 2022 |
$ | $ | ||||||||||||||
|
|
Number of Options |
Weighted– Average Exercise Price |
|||||||
Outstanding and unvested as of December 31, 2021 |
$ | |||||||
Vested |
( |
) | ||||||
|
|
|||||||
Outstanding and unvested as of March 31, 2022 |
$ | |||||||
|
|
Three Months Ended March 31, | ||
2021 | ||
Fair value of common stock |
$ | |
Expected term (in years) |
||
Volatility |
||
Risk-free interest rate |
||
Dividend yield |
— |
Number of shares |
Weighted– Average Grant Date Fair Value Per Share |
|||||||
Unvested – December 31, 2021 |
$ | |||||||
Granted |
||||||||
Forfeited |
( |
) | ||||||
Unvested – March 31, 2022 |
$ | |||||||
10. |
Net Loss Per Share Attributable to Common Stockholders |
Three Months Ended March 31, |
||||||||
2021 |
2022 |
|||||||
Convertible preferred stock |
||||||||
Contingently redeemable convertible common stock |
— | |||||||
Common stock options |
||||||||
Restricted stock units |
— | |||||||
Convertible preferred stock warrants |
||||||||
Common stock warrants |
||||||||
Shares subject to repurchase |
||||||||
Total |
||||||||
11. |
Subsequent Events |
Amount | ||||
SEC registration fee |
$ | 15,658 | ||
Legal fees and expenses |
* | |||
Accounting fees and expenses |
* | |||
Miscellaneous |
* | |||
Total |
* |
* | These fees are calculated based on the securities offered and the number of issuances and accordingly cannot be defined at this time. |
+ | Indicates management contract or compensatory plan or arrangement. |
† | Schedules and exhibits to this agreement have been omitted pursuant to Item 601(b)(2) of Regulation S-K. A copy of any omitted schedule and/or exhibit will be furnished to the SEC upon request. |
†† | The Registrant has redacted provisions or terms of this Exhibit pursuant to Regulation S-K Item 601(b)(10)(iv). The Registrant agrees to furnish an unredacted copy of the Exhibit to the SEC upon its request. |
* | Filed herewith. |
A. | To file, during any period in which offers or sales are being made, a post-effective amendment to this registration statement: |
(i) | To include any prospectus required by section 10(a)(3) of the Securities Act; |
(ii) | To reflect in the prospectus any facts or events arising after the effective date of the registration statement (or the most recent post-effective amendment thereof) which, individually or in the aggregate, represent a fundamental change in the information set forth in the registration statement. Notwithstanding the foregoing, any increase or decrease in volume of securities offered (if the total dollar value of securities offered would not exceed that which was registered) and any deviation from the low or high end of the estimated maximum offering range may be reflected in the form of prospectus filed with the SEC pursuant to Rule 424(b) if, in the aggregate, the changes in volume and price represent no more than 20% change in the maximum aggregate offering price set forth in the “Calculation of Registration Fee” table in the effective registration statement. |
(iii) | To include any material information with respect to the plan of distribution not previously disclosed in the registration statement or any material change to such information in the registration statement; |
B. | That, for the purpose of determining any liability under the Securities Act, each such post-effective amendment shall be deemed to be a new registration statement relating to the securities offered therein, and the offering of such securities at that time shall be deemed to be the initial bona fide offering thereof. |
C. | To remove from registration by means of a post-effective amendment any of the securities being registered which remain unsold at the termination of the offering. |
D. | That, for the purpose of determining liability under the Securities Act to any purchaser, each prospectus filed pursuant to Rule 424(b) as part of a registration statement relating to an offering, other than registration statements relying on Rule 430B or other than prospectuses filed in reliance on Rule 430A, shall be deemed to be part of and included in the registration statement as of the date it is first used after effectiveness. Provided, however, that no statement made in a registration statement or prospectus that is part of the registration statement or made in a document incorporated or deemed incorporated by reference into the registration statement or prospectus that is part of the registration statement will, as to a purchaser with a time of contract of sale prior to such first use, supersede or modify any statement that was made in the registration statement or prospectus that was part of the registration statement or made in any such document immediately prior to such date of first use. |
E. | That, for the purpose of determining liability of the registrant under the Securities Act to any purchaser in the initial distribution of the securities, that in a primary offering of securities of the undersigned registrant pursuant to this registration statement, regardless of the underwriting method used to sell the securities to the purchaser, if the securities are offered or sold to such purchaser by means of any of the following communications, the undersigned registrant will be a seller to the purchaser and will be considered to offer or sell such securities to such purchaser: |
(i) | Any preliminary prospectus or prospectus of the undersigned registrant relating to the offering required to be filed pursuant to Rule 424; |
(ii) | Any free writing prospectus relating to the offering prepared by or on behalf of the undersigned registrant or used or referred to by the undersigned registrant; |
(iii) | The portion of any other free writing prospectus relating to the offering containing material information about the undersigned registrant or its securities provided by or on behalf of the undersigned registrant; and |
(iv) | Any other communication that is an offer in the offering made by the undersigned registrant to the purchaser. |
F. | Insofar as indemnification for liabilities arising under the Securities Act may be permitted to directors, officers and controlling persons of the registrant pursuant to the foregoing provisions, or otherwise, the registrant has been advised that in the opinion of the SEC such indemnification is against public policy as expressed in the Securities Act and is, therefore, unenforceable. In the event that a claim for indemnification against such liabilities (other than the payment by the registrant of expenses incurred |
or paid by a director, officer or controlling person of the registrant in the successful defense of any action, suit or proceeding) is asserted by such director, officer or controlling person in connection with the securities being registered, the registrant will, unless in the opinion of its counsel the matter has been settled by controlling precedent, submit to a court of appropriate jurisdiction the question whether such indemnification by it is against public policy as expressed in the Securities Act and will be governed by the final adjudication of such issue. |
GROVE COLLABORATIVE HOLDINGS, INC. | ||
By: | /s/ Stuart Landesberg | |
Stuart Landesberg | ||
Chief Executive Officer |
Name |
Title |
Date | ||
/s/ Stuart Landesberg Stuart Landesberg |
Chief Executive Officer and Director (principal executive officer) |
July 18, 2022 | ||
/s/ Sergio Cervantes Sergio Cervantes |
Chief Financial Officer (principal financial and accounting officer) |
July 18, 2022 | ||
/s/ Christopher Clark Christopher Clark |
Director | July 18, 2022 | ||
/s/ David Glazer David Glazer |
Director | July 18, 2022 | ||
/s/ John Replogle John Replogle |
Director | July 18, 2022 | ||
/s/ Kristine Miller Kristine Miller |
Director | July 18, 2022 | ||
/s/ Naytri Shroff Sramek Naytri Shroff Sramek |
Director | July 18, 2022 | ||
/s/ Rayhan Arif Rayhan Arif |
Director | July 18, 2022 | ||
/s/ Fumbi Chima Fumbi Chima |
Director | July 18, 2022 |