
Exhibit 99.2

NOTES START FROM HERE AND GROW UP CONTENT BELOW THIS LINE CONTENT BELOW THIS LINE SUBTITLE BELOW THIS LINE TITLE CAN NOT GO ABOVE THIS LINE 1 DECEMBER 2021 Investor Presentation

NOTES START FROM HERE AND GROW UP CONTENT BELOW THIS LINE CONTENT BELOW THIS LINE SUBTITLE BELOW THIS LINE TITLE CAN NOT GO ABOVE THIS LINE 2 2 Confidentiality and Basis of Presentation This Presentation (this “Presentation”) is provided for informational purposes only and has been prepared to assist intereste d p arties in making their own evaluation with respect to a potential business combination between Grove Collaborative, Inc. (“Gr ove ”) and Virgin Group Acquisition Corp. II (“VG”) and related transactions (the “Potential Business Combination”) and for no other purpose. By accepting, reviewing or reading thi s Presentation, you will be deemed to have agreed to the obligations and restrictions set out below. Without the express prio r w ritten consent of VG and Grove, this Presentation and any information contained within it may not be (i) reproduced (in whole or in part), (ii) copied at any time , ( iii) used for any purpose other than your evaluation of Grove or (iv) provided to any other person, except your employees and ad visors with a need to know who are advised of the confidentiality of the information. This Presentation supersedes and replaces all previous oral or written communications be twe en the parties hereto relating to the subject matter hereof. The information in this Presentation is highly confidential. The distribution of this Presentation by an authorized recipient to any other person is unauthorized. Any photocopying, disclosure, reproduction or alteration of the contents of this Presentati on and any forwarding of a copy of this Presentation or any portion of this Presentation to any person is prohibited. The recipient of this Presentation shall keep this Presentation an d its contents confidential and shall be required to return or destroy all copies of this Presentation or portions thereof in it s possession promptly following request for the return or destruction of such copies. By accepting delivery of this Presentation, the recipient is deemed to agree to the foregoing co nfi dentiality requirements. This Presentation and any oral statements made in connection with this Presentation do not constitute an offer to sell, or a sol icitation of an offer to buy, or a recommendation to purchase, any securities in any jurisdiction, or the solicitation of any vo te, consent or approval in any jurisdiction in connection with the Potential Business Combination or any related transactions, nor shall there be any sale, issuance or transfer of any se curities in any jurisdiction where, or to any person to whom, such offer, solicitation or sale may be unlawful under the laws of such jurisdiction. This Presentation does not constitute either advice or a recommendation regarding any securities. Any offer to sell securities will be made only pursuan t t o a definitive Subscription Agreement and will be made in reliance on an exemption from registration under the Securities Act of 1933, as amended, for offers and sales of securities that do not involve a public offering. VG and Grove reserve the right to withdraw or amend for any reason any offe rin g and to reject any Subscription Agreement for any reason. The communication of this Presentation is restricted by law; it is no t intended for distribution to, or use by any person in, any jurisdiction where such distribution or use would be contrary to local law or regulation. No representations or warranties, express or implied are given in, or in respect of, this Presentation. Industry and market d ata used in this Presentation have been obtained from third - party industry publications and sources as well as from research report s prepared for other purposes. Neither VG nor Grove has independently verified the data obtained from these sources and cannot assure you of the data’s accuracy or complet ene ss. This data is subject to change. Recipients of this Presentation are not to construe its contents, or any prior or subsequ ent communications from or with VG, Grove or their respective affiliates or representatives as investment, legal or tax advice. In addition, this Presentation does not pu rpo rt to be all - inclusive or to contain all of the information that may be required to make a full analysis of Grove or the Potenti al Business Combination. Recipients of this Presentation should each make their own evaluation of Grove and of the relevance and adequacy of the information and should make such othe r i nvestigations as they deem necessary. To the fullest extent permitted by law, in no circumstances will VG, Grove or any of th eir respective stockholders, affiliates, representatives, partners, directors, officers, employees, advisers or agents be responsible or liable for any direct, indire ct, or consequential loss or loss of profit arising from the use of this presentation, its contents, its omissions, reliance on t he information contained within it or on opinions communicated in relation thereto or otherwise arising in connection therewith. Forward - Looking Statements Certain statements included in this Presentation are not historical facts but are forward - looking statements for purposes of the safe harbor provisions under the United States Private Securities Litigation Reform Act of 1995. Forward - looking statements gen erally are accompanied by words such as “believe,” “may,” “will,” “estimate,” “continue,” “anticipate,” “intend,” “expect,” “should,” “would,” “plan,” “predict,” “po ten tial,” “seem,” “seek,” “future,” “outlook,” and similar expressions that predict or indicate future events or trends or that are not statements of historical matters, but the absence of these words does not mean that a statement is not forward - looking. These forward - looking statements include, but are not limited to, (1) statements regarding estimates and forecasts of other financial and performance metrics and projections of market opp or tunity; (2) references with respect to the anticipated benefits of the Potential Business Combination and the projected future financial performance of Grove and Grove’ s o perating companies following the Potential Business Combination; (3) changes in the market for Grove’s products, and expansio n p lans and opportunities; (4) anticipated customer retention; (5) the sources and uses of cash of the Potential Business Combination; (6) the anticipated capitalizatio n a nd enterprise value of the combined company following the consummation of the Potential Business Combination; and (7) expecta tio ns related to the terms and timing of the Potential Business Combination. These statements are based on various assumptions, whether or not identified in this Presenta tio n, and on the current expectations of Grove’s management and are not predictions of actual performance. These forward - looking st atements are provided for illustrative purposes only and are not intended to serve as, and must not be relied on by any investor as, a guarantee, an assurance, a pr edi ction or a definitive statement of fact or probability. Actual events and circumstances are difficult or impossible to predic t a nd will differ from assumptions. Many actual events and circumstances are beyond the control of Grove. These forward - looking statements are subject to a number of risks and uncerta inties, including: changes in domestic and foreign business, market, financial, political and legal conditions; the failure o f t he parties to enter into a definitive merger agreement (or the termination thereof) with respect to the Potential Business Combination; the inability of the parties to su cce ssfully or timely consummate the Potential Business Combination, including the risk that any required stockholder or regulato ry approvals are not obtained, are delayed or are subject to unanticipated conditions that could adversely affect the combined company or the expected benefits of the Potentia l B usiness Combination is not obtained; failure to realize the anticipated benefits of the Potential Business Combination; risks re lating to the uncertainty of the projected financial information with respect to Grove; Grove’s ability to successfully expand its business; competition; the uncertain effects of th e COVID - 19 pandemic; and those factors discussed in documents of VG filed, or to be filed, with the U.S. Securities and Exchange Commission (the “SEC”). If any of these risks materialize or our assumptions prove incorrect, actual results could differ materially from the results implied by these forw ard - looking statements. There may be additional risks that neither VG nor Grove presently know or that VG and Grove currently bel ie ve are immaterial that could also cause actual results to differ from those contained in the forward - looking statements. In addition, forward - looking statements reflect VG’s a nd Grove’s expectations, plans or forecasts of future events and views as of the date of this Presentation. VG and Grove anti cip ate that subsequent events and developments will cause VG’s and Grove’s assessments to change. However, while VG and Grove may elect to update these forward - looking stateme nts at some point in the future, VG and Grove specifically disclaim any obligation to do so. These forward - looking statements sh ould not be relied upon as representing VG’s and Grove’s assessments as of any date subsequent to the date of this Presentation. Accordingly, undue reliance should n ot be placed upon the forward - looking statements. Use of Data The data contained herein is derived from various internal and external sources. No representation is made as to the reasonab len ess of the assumptions made within or the accuracy or completeness of any projections or modeling or any other information co nta ined herein. Any data on past performance or modeling contained herein is not an indication as to future performance. VG and Grove assume no obligation to update the i nfo rmation in this Presentation. Trademarks VG and Grove own or have rights to various trademarks, service marks and trade names that they use in connection with the ope rat ion of their respective businesses. This Presentation may also contain trademarks, service marks, trade names and copyrights of third parties, which are the property of their respective owners. The use or display of third parties’ trademarks, service marks, trade names or products in this Pres ent ation is not intended to, and does not imply, a relationship with VG or Grove, or an endorsement or sponsorship by or of VG o r G rove. Solely for convenience, the trademarks, service marks, trade names and copyrights referred to in this Presentation may appear without the TM, SM, ® or © symbols, but su ch references are not intended to indicate, in any way, that VG or Grove will not assert, to the fullest extent under applica ble law, their rights or the right of the applicable licensor to these trademarks, service marks, trade names and copyrights. Disclaimer

NOTES START FROM HERE AND GROW UP CONTENT BELOW THIS LINE CONTENT BELOW THIS LINE SUBTITLE BELOW THIS LINE TITLE CAN NOT GO ABOVE THIS LINE 3 3 Use of Projections This Presentation contains projected financial information with respect to Grove, namely revenue and gross margin, gross prod uct margin, Grove brands revenue share, gross revenue share by brand, gross profit, adjusted EBITDA, adjusted EBITDA margin, fulf il lment cost, operating expenses, advertising spend. Such projected financial information constitutes forward - looking information, and is for illustrative purpose s only and should not be relied upon as necessarily being indicative of future results. The projections, estimates and targe ts in this Presentation are forward - looking statements that are based on assumptions that are inherently subject to significant uncertainties and contingencies, many of which are b eyo nd VG’s and Grove’s control. See “Forward - Looking Statements” above. While all projections, estimates and targets are necessaril y speculative, VG and Grove believe that the preparation of prospective financial information involves increasingly higher levels of uncertainty the further out the p roj ection, estimate or target extends from the date of preparation. The assumptions and estimates underlying the projected, expe cte d or target results are inherently uncertain and are subject to a wide variety of significant business, economic, regulatory, competitive and other risks and uncertainties that c oul d cause actual results to differ materially from those contained in such projections, estimates and targets. The inclusion of pr ojections, estimates and targets in this Presentation should not be regarded as an indication that VG and Grove, or their representatives, considered or consider the financial pro jec tions, estimates and targets to be a reliable prediction of future events. Neither the independent auditors of VG nor the in dep endent registered public accounting firm of Grove has audited, reviewed, compiled or performed any procedures with respect to the projections for the purpose of their inclusio n i n this Presentation, and accordingly, neither of them expressed an opinion or provided any other form of assurance with respe ct thereto for the purpose of this Presentation. Financial Information; Non - GAAP Financial Measures The Grove financial information and data for the fiscal years ended December 31, 2019 and 2020 included herein are audited in ac cordance with Association of International Certified Professional Accountants (AICPA) auditing standards. Some of the financial information and data contained in this Presentation, such as gross product margin, contribution profit and adjusted EBITDA, have not been prepared in accordance with United States generally accepted accounting principles (“GAAP”). T he se non - GAAP measures, and other measures that are calculated using such non - GAAP measures, are an addition to, and not a substitute for or superior to, measures of financial performance prepared in accordance with GAAP and should not be considered as an alternative to revenue, operatin g income, profit before tax, net income or any other performance measures derived in accordance with GAAP. A reconciliation of adjusted EBITDA to Net Income is provided at the end of this presentation. A reconciliation of the projected non - GAAP financial measures has not been provided and is unable to be provided without unreaso nable effort because certain items excluded from these non - GAAP financial measures such as charges related to stock - based compensation expenses and related tax effects, including non - recurring income tax adjustments, cannot be reasonably calculated or predicted at this time. VG and Grove believe these non - GAAP measures of financial results, including on a forward - looking basis, provide useful informat ion to management and investors regarding certain financial and business trends relating to Grove’s financial condition and r esu lts of operations. Grove’s management uses these non - GAAP measures for trend analyses and for budgeting and planning purposes. VG and Grove believe that the use of these n on - GAAP financial measures provides an additional tool for investors to use in evaluating projected operating results and trends in and in comparing Grove’s financial measures with other similar companies, many of which present similar non - GAAP financial measures to investors. Management of VG does not consider these non - GAAP measures in isolation or as an alternative to financial measures determined in accordance with GAAP. However, there are a number of limitations related to the use of these non - GAAP measures and their nearest GAAP equivalents. For example, other companies may calculate non - GAAP measures differently, or may use other measures to calculate their financial pe rformance, and therefore Grove’s non - GAAP measures may not be directly comparable to similarly titled measures of other companies. See the footnotes on the slides wh ere these measures are discussed and the Appendix for definitions of these non - GAAP financial measures and reconciliations of th ese non - GAAP financial measures to the most directly comparable GAAP measures. Important Information for Investors and Stockholders VG and Grove and their respective directors and executive officers, under SEC rules, may be deemed to be participants in the sol icitation of proxies of VG’s shareholders in connection with the Potential Business Combination. Investors and security holde rs may obtain more detailed information regarding the names and interests in the Potential Business Combination of VG’s directors and officers in VG’s filings with t he SEC, including VG’s registration statement on Form S - 1, which was originally filed with the SEC on [February 12, 2021] . To the extent that holdings of VG’s securities have changed from the amounts reported in VG’s registration statement on Form S - 1, such changes have been or will be reflected on Sta tements of Change in Ownership on Form 4 filed with the SEC. Information regarding the persons who may, under SEC rules, be d eem ed participants in the solicitation of proxies to VG’s shareholders in connection with the Potential Business Combination will be set forth in the proxy statement/p ros pectus on Form S - 4 for the Potential Business Combination, which is expected to be filed by VG with the SEC. This Presentation is not a substitute for the registration statement or for any other document that VG may file with the SEC in connection with the Potential Business Combination. INVESTORS AND SECURITY HOLDERS ARE URGED TO READ THE DOCUMENTS FILED WITH TH E SEC CAREFULLY AND IN THEIR ENTIRETY WHEN THEY BECOME AVAILABLE BECAUSE THEY WILL CONTAIN IMPORTANT INFORMATION. Investors and security hold ers may obtain free copies of other documents filed with the SEC by VG through the website maintained by the SEC at http://www.se c. gov. INVESTMENT IN ANY SECURITIES DESCRIBED HEREIN HAS NOT BEEN APPROVED OR DISAPPROVED BY THE SEC OR ANY OTHER REGULATORY AUTHORI TY NOR HAS ANY AUTHORITY PASSED UPON OR ENDORSED THE MERITS OF THE OFFERING OR THE ACCURACY OR ADEQUACY OF THE INFORMATION CONTAINED HEREIN. ANY REPRESENTATION TO THE CONTRARY IS A CRIMINAL OFFENSE. Disclaimer (Cont’d.)
NOTES START FROM HERE AND GROW UP CONTENT BELOW THIS LINE CONTENT BELOW THIS LINE SUBTITLE BELOW THIS LINE TITLE CAN NOT GO ABOVE THIS LINE 4 4 CEO, Grove Collaborative Stu Landesberg CIO, Virgin Group CFO, VGII Evan Lovell TODAY’S PRESENTERS Co - CFO Phil Moon
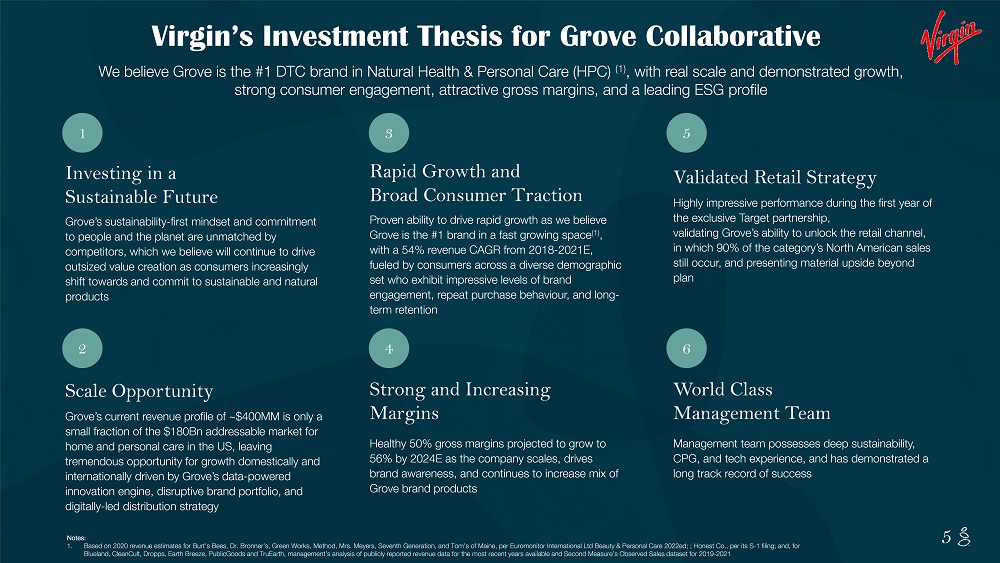
NOTES START FROM HERE AND GROW UP CONTENT BELOW THIS LINE CONTENT BELOW THIS LINE SUBTITLE BELOW THIS LINE TITLE CAN NOT GO ABOVE THIS LINE 5 5 6 World Class Management Team Management team possesses deep sustainability, CPG, and tech experience, and has demonstrated a long track record of success 4 Strong and Increasing Margins Healthy 50% gross margins projected to grow to 56% by 2024E as the company scales, drives brand awareness, and continues to increase mix of Grove brand products 2 Scale Opportunity Grove’s current revenue profile of ~$400MM is only a small fraction of the $180Bn addressable market for home and personal care in the US, leaving tremendous opportunity for growth domestically and internationally driven by Grove’s data - powered innovation engine, disruptive brand portfolio, and digitally - led distribution strategy 1 Investing in a Sustainable Future Grove’s sustainability - first mindset and commitment to people and the planet are unmatched by competitors, which we believe will continue to drive outsized value creation as consumers increasingly shift towards and commit to sustainable and natural products 3 Rapid Growth and Broad Consumer Traction Proven ability to drive rapid growth as we believe Grove is the #1 brand in a fast growing space (1) , with a 54% revenue CAGR from 2018 - 2021E, fueled by consumers across a diverse demographic set who exhibit impressive levels of brand engagement, repeat purchase behaviour, and long - term retention 5 Validated Retail Strategy Highly impressive performance during the first year of the exclusive Target partnership, validating Grove’s ability to unlock the retail channel, in which 90% of the category’s North American sales still occur, and presenting material upside beyond plan Virgin’s Investment Thesis for Grove Collaborative We believe Grove is the #1 DTC brand in Natural Health & Personal Care (HPC) (1) , with real scale and demonstrated growth, strong consumer engagement, attractive gross margins, and a leading ESG profile Notes: 1. Based on 2020 revenue estimates for Burt’s Bees, Dr. Bronner’s, Green Works, Method, Mrs. Meyers, Seventh Generation, and Tom ’s of Maine, per Euromonitor International Ltd Beauty & Personal Care 2022ed; ; Honest Co., per its S - 1 filing; and, for Blueland , CleanCult , Dropps , Earth Breeze, PublicGoods and TruEarth , management’s analysis of publicly reported revenue data for the most recent years available and Second Measure’s Observed S ale s dataset for 2019 - 2021
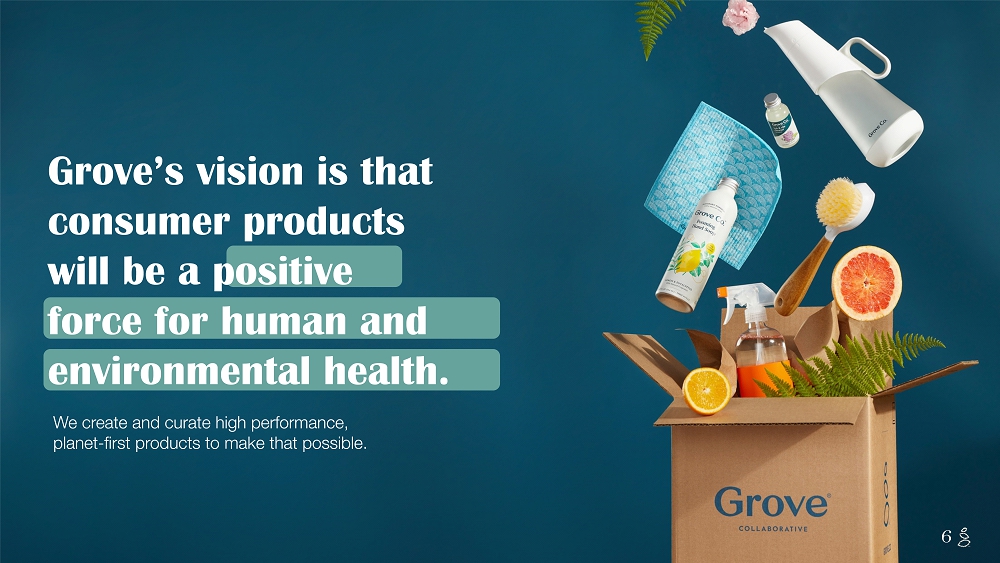
NOTES START FROM HERE AND GROW UP CONTENT BELOW THIS LINE CONTENT BELOW THIS LINE SUBTITLE BELOW THIS LINE TITLE CAN NOT GO ABOVE THIS LINE 6 6 We create and curate high performance, planet - first products to make that possible. Grove’s vision is that consumer products will be a positive force for human and environmental health.
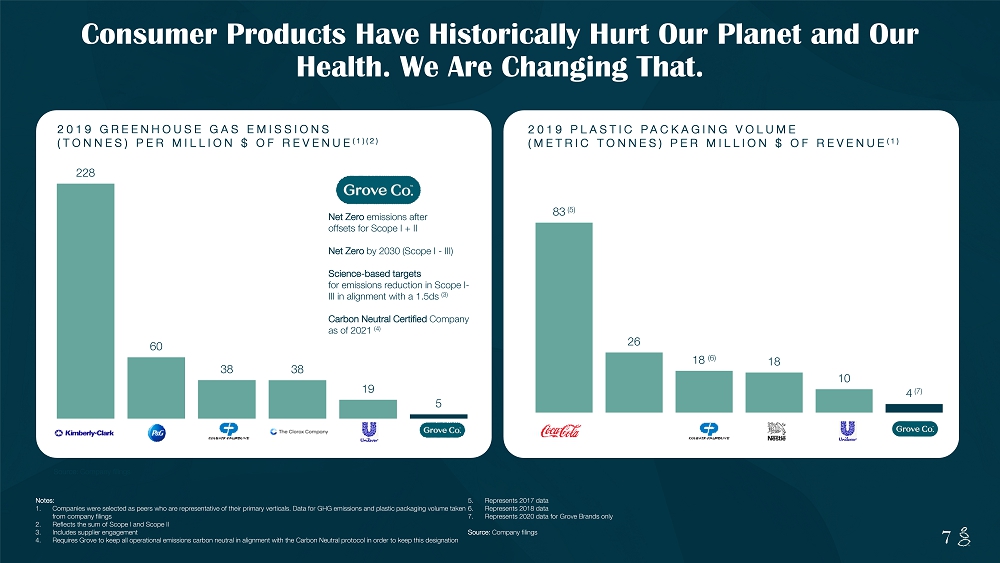
NOTES START FROM HERE AND GROW UP CONTENT BELOW THIS LINE CONTENT BELOW THIS LINE SUBTITLE BELOW THIS LINE TITLE CAN NOT GO ABOVE THIS LINE 7 7 228 60 38 38 19 5 Consumer Products Have Historically Hurt Our Planet and Our Health. We Are Changing That. 83 (5) 26 18 (6) 18 10 4 (7) Source: Company filings Net Zero emissions after offsets for Scope I + II Net Zero by 2030 (Scope I - III) Science - based targets for emissions reduction in Scope I - III in alignment with a 1.5ds (3) Carbon Neutral Certified Company as of 2021 (4) 2019 GREENHOUSE GAS EMISSIONS (TONNES) PER MILLION $ OF REVENUE (1)(2) Notes: 1. Companies were selected as peers who are representative of their primary verticals. Data for GHG emissions and plastic packag ing volume taken from company filings 2. Reflects the sum of Scope I and Scope II 3. Includes supplier engagement 4. Requires Grove to keep all operational emissions carbon neutral in alignment with the Carbon Neutral protocol in order to kee p t his designation 5. Represents 2017 data 6. Represents 2018 data 7. Represents 2020 data for Grove Brands only Source: Company filings 2019 PLASTIC PACKAGING VOLUME (METRIC TONNES) PER MILLION $ OF REVENUE (1)

NOTES START FROM HERE AND GROW UP CONTENT BELOW THIS LINE CONTENT BELOW THIS LINE SUBTITLE BELOW THIS LINE TITLE CAN NOT GO ABOVE THIS LINE 8 8
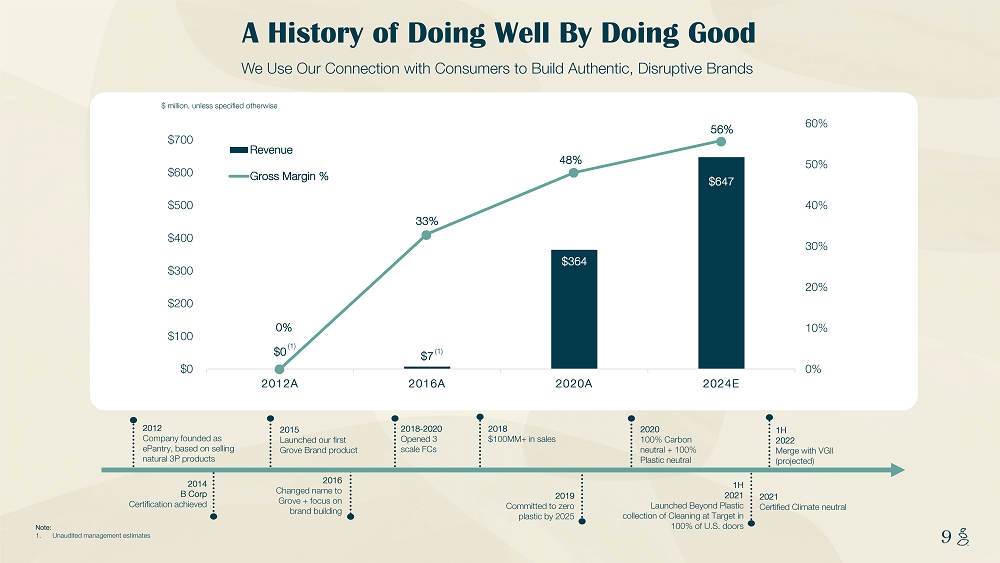
NOTES START FROM HERE AND GROW UP CONTENT BELOW THIS LINE CONTENT BELOW THIS LINE SUBTITLE BELOW THIS LINE TITLE CAN NOT GO ABOVE THIS LINE 9 9 A History of Doing Well By Doing Good $ million, unless specified otherwise $0 $7 $364 $647 0% 33% 48% 56% 0% 10% 20% 30% 40% 50% 60% $0 $100 $200 $300 $400 $500 $600 $700 2012A 2016A 2020A 2024E Revenue Gross Margin % 2016 Changed name to Grove + focus on brand building 2019 Committed to zero plastic by 2025 1H 2021 Launched Beyond Plastic collection of Cleaning at Target in 100% of U.S. doors 2012 Company founded as ePantry , based on selling natural 3P products 2014 B Corp Certification achieved 2015 Launched our first Grove Brand product 2018 - 2020 Opened 3 scale FCs 2020 100% Carbon neutral + 100% Plastic neutral 1H 2022 Merge with VGII (projected) 2018 $100MM+ in sales 2021 Certified Climate neutral We Use Our Connection with Consumers to Build Authentic, Disruptive Brands (1) (1) Note: 1. Unaudited management estimates
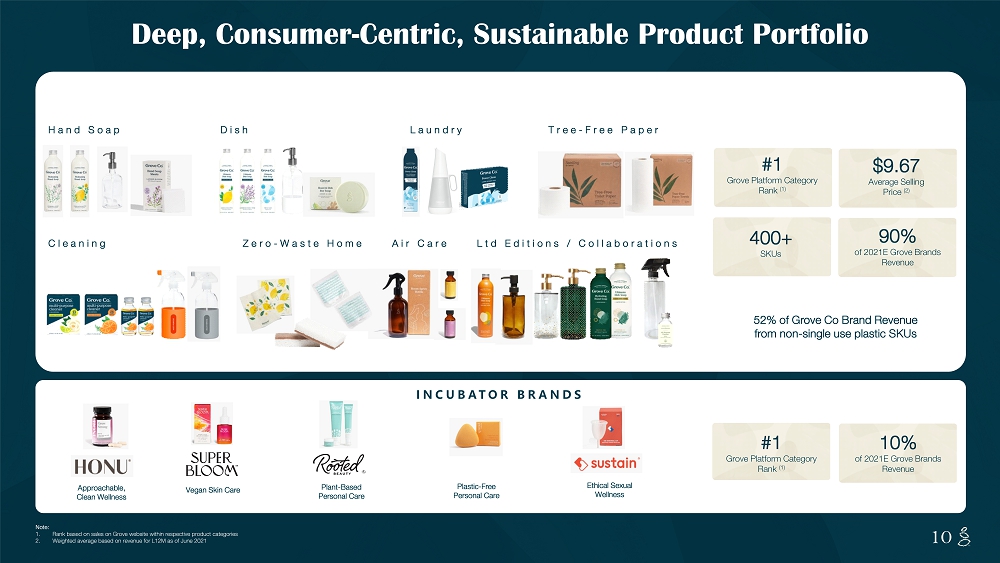
NOTES START FROM HERE AND GROW UP CONTENT BELOW THIS LINE CONTENT BELOW THIS LINE SUBTITLE BELOW THIS LINE TITLE CAN NOT GO ABOVE THIS LINE 10 10 Deep, Consumer - Centric, Sustainable Product Portfolio INCUBATOR BRANDS Approachable, Clean Wellness Plastic - Free Personal Care Ethical Sexual Wellness Plant - Based Personal Care Vegan Skin Care Note: 1. Rank based on sales on Grove website within respective product categories 2. Weighted average based on revenue for L12M as of June 2021 Hand Soap Dish Laundry Zero - Waste Home Cleaning Tree - Free Paper Air Care Ltd Editions / Collaborations #1 Grove Platform Category Rank (1) 10% of 2021E Grove Brands Revenue #1 Grove Platform Category Rank (1) 400+ SKUs $9.67 Average Selling Price (2) 90% of 2021E Grove Brands Revenue 52% of Grove Co Brand Revenue from non - single use plastic SKUs
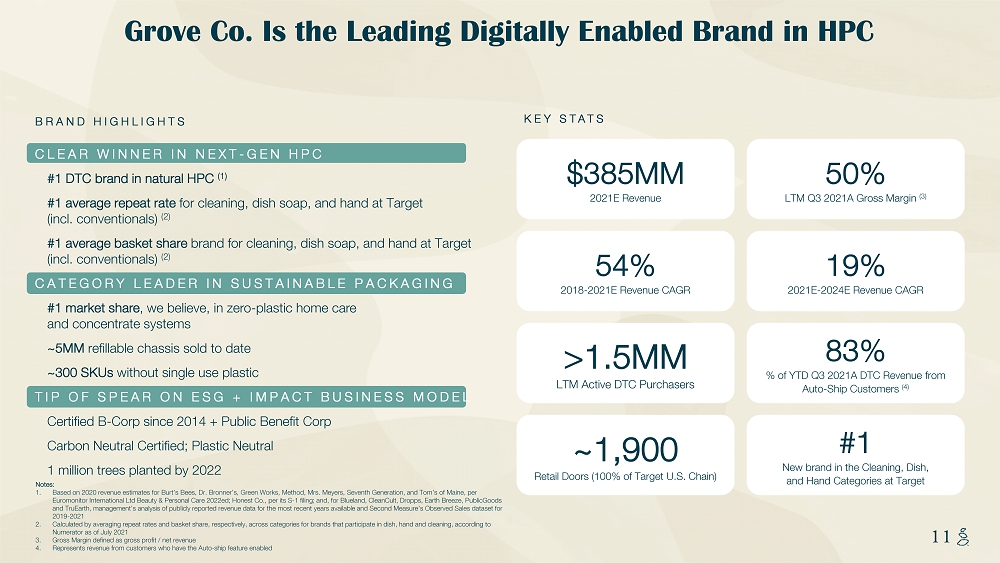
NOTES START FROM HERE AND GROW UP CONTENT BELOW THIS LINE CONTENT BELOW THIS LINE SUBTITLE BELOW THIS LINE TITLE CAN NOT GO ABOVE THIS LINE 11 11 CLEAR WINNER IN NEXT - GEN HPC #1 DTC brand in natural HPC (1) #1 average repeat rate for cleaning, dish soap, and hand at Target (incl. conventionals ) (2) #1 average basket share brand for cleaning, dish soap, and hand at Target (incl. conventionals ) (2) CATEGORY LEADER IN SUSTAINABLE PACKAGING #1 market share , we believe, in zero - plastic home care and concentrate systems ~5MM refillable chassis sold to date ~300 SKUs without single use plastic TIP OF SPEAR ON ESG + IMPACT BUSINESS MODEL Certified B - Corp since 2014 + Public Benefit Corp Carbon Neutral Certified; Plastic Neutral 1 million trees planted by 2022 Grove Co. Is the Leading Digitally Enabled Brand in HPC 54% 2018 - 2021E Revenue CAGR >1.5MM LTM Active DTC Purchasers ~1,900 Retail Doors (100% of Target U.S. Chain) 19% 2021E - 2024E Revenue CAGR 83% % of YTD Q3 2021A DTC Revenue from Auto - Ship Customers (4) #1 New brand in the Cleaning, Dish, and Hand Categories at Target $385MM 2021E Revenue 50% LTM Q3 2021A Gross Margin (3) KEY STATS BRAND HIGHLIGHTS Notes: 1. Based on 2020 revenue estimates for Burt’s Bees, Dr. Bronner’s, Green Works, Method, Mrs. Meyers, Seventh Generation, and Tom ’s of Maine, per Euromonitor International Ltd Beauty & Personal Care 2022ed; Honest Co., per its S - 1 filing; and, for Blueland , CleanCult , Dropps , Earth Breeze, PublicGoods and TruEarth , management’s analysis of publicly reported revenue data for the most recent years available and Second Measure’s Observed S ale s dataset for 2019 - 2021 2. Calculated by averaging repeat rates and basket share, respectively, across categories for brands that participate in dish, h and and cleaning, according to Numerator as of July 2021 3. Gross Margin defined as gross profit / net revenue 4. Represents revenue from customers who have the Auto - ship feature enabled
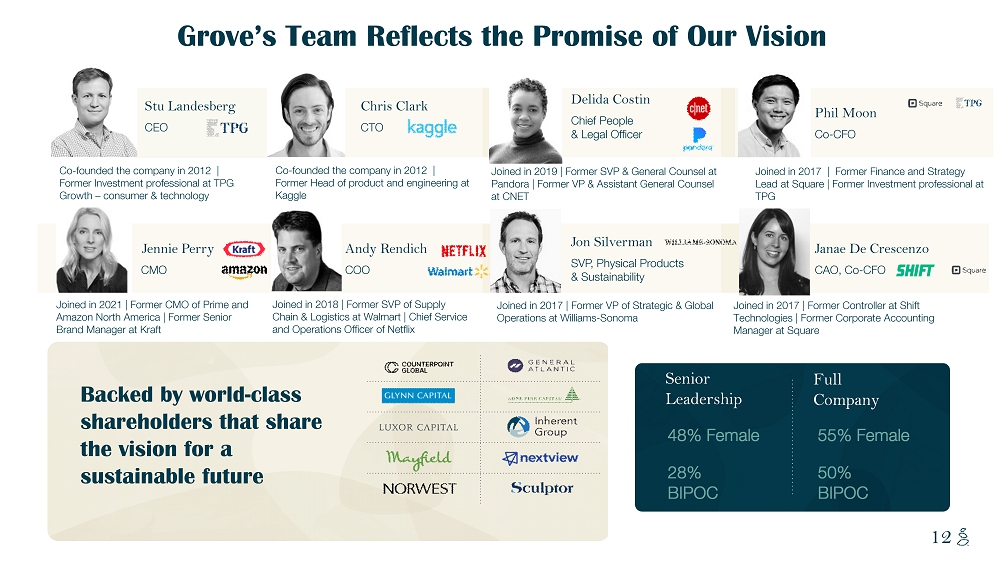
NOTES START FROM HERE AND GROW UP CONTENT BELOW THIS LINE CONTENT BELOW THIS LINE SUBTITLE BELOW THIS LINE TITLE CAN NOT GO ABOVE THIS LINE 12 Stu Landesberg CEO Co - founded the company in 2012 | Former Investment professional at TPG Growth – consumer & technology Chris Clark CTO Co - founded the company in 2012 | Former Head of product and engineering at Kaggle Backed by world - class shareholders that share the vision for a sustainable future 55% Female Senior Leadership Full Company Jennie Perry C MO Joined in 2021 | Former CMO of Prime and Amazon North America | Former Senior Brand Manager at Kraft Andy Rendich C O O Joined in 2018 | Former SVP of Supply Chain & Logistics at Walmart | Chief Service and Operations Officer of Netflix Jon Silverman SVP, Physical Products & Sustainability Joined in 2017 | Former VP of Strategic & Global Operations at Williams - Sonoma 48% Female 50 % BIPOC 28% BIPOC Janae De Crescenzo CAO, Co - CFO Joined in 2017 | Former Controller at Shift Technologies | Former Corporate Accounting Manager at Square Grove’s Team Reflects the Promise of Our Vision Phil Moon Co - CFO Delida Costin Chief People & Legal Officer Joined in 2019 | Former SVP & General Counsel at Pandora | Former VP & Assistant General Counsel at CNET Joined in 2017 | Former Finance and Strategy Lead at Square | Former Investment professional at TPG
NOTES START FROM HERE AND GROW UP CONTENT BELOW THIS LINE CONTENT BELOW THIS LINE SUBTITLE BELOW THIS LINE TITLE CAN NOT GO ABOVE THIS LINE 13 SECTION 1 Winning The $1T HPC Market 13
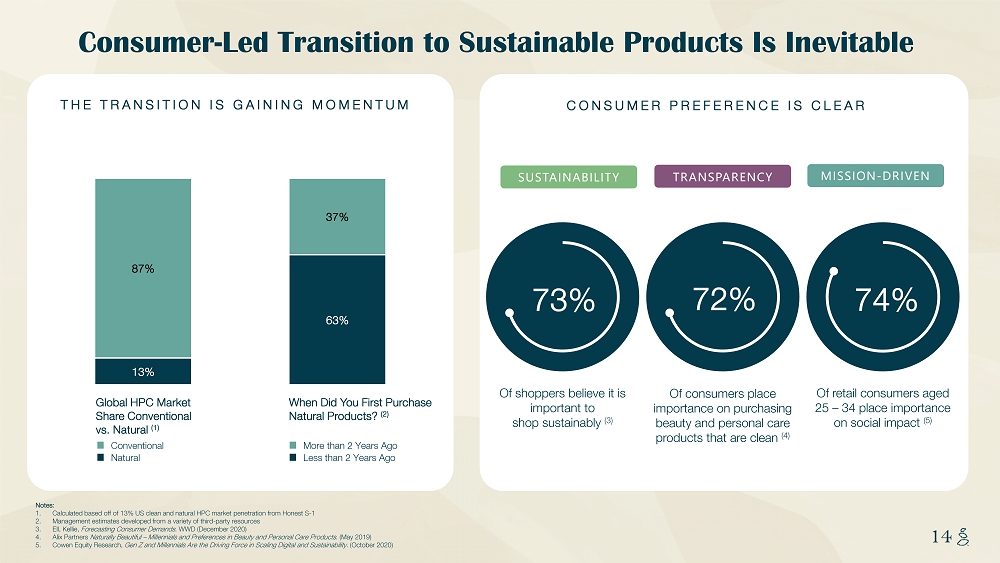
NOTES START FROM HERE AND GROW UP CONTENT BELOW THIS LINE CONTENT BELOW THIS LINE SUBTITLE BELOW THIS LINE TITLE CAN NOT GO ABOVE THIS LINE 14 14 Notes: 1. Calculated based off of 13% US clean and natural HPC market penetration from Honest S - 1 2. Management estimates developed from a variety of third - party resources 3. Ell, Kellie, Forecasting Consumer Demands . WWD (December 2020) 4. Alix Partners Naturally Beautiful – Millennials and Preferences in Beauty and Personal Care Products . (May 2019) 5. Cowen Equity Research, Gen Z and Millennials Are the Driving Force in Scaling Digital and Sustainability. (October 2020) 13% 63% 87% 37% THE TRANSITION IS GAINING MOMENTUM When Did You First Purchase Natural Products? (2) More than 2 Years Ago Less than 2 Years Ago Conventional Natural Global HPC Market Share Conventional vs. Natural (1) Consumer - Led Transition to Sustainable Products Is Inevitable Of retail consumers aged 25 – 34 place importance on social impact (5) Of consumers place importance on purchasing beauty and personal care products that are clean (4) TRANSPARENCY Of shoppers believe it is important to shop sustainably (3) SUSTAINABILITY CONSUMER PREFERENCE IS CLEAR MISSION - DRIVEN 74% 72% 73%
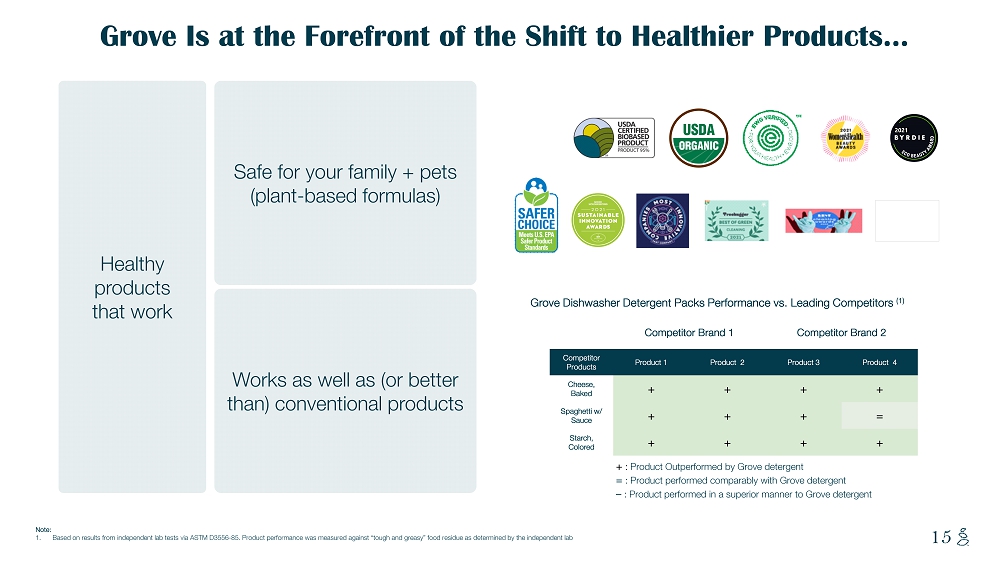
NOTES START FROM HERE AND GROW UP CONTENT BELOW THIS LINE CONTENT BELOW THIS LINE SUBTITLE BELOW THIS LINE TITLE CAN NOT GO ABOVE THIS LINE 15 Grove Is at the Forefront of the Shift to Healthier Products… Healthy products that work Works as well as (or better than) conventional products Safe for your family + pets (plant - based formulas) Grove Dishwasher Detergent Packs Performance vs. Leading Competitors (1) Competitor Brand 1 Competitor Brand 2 Competitor Products Product 1 Product 2 Product 3 Product 4 Cheese, Baked + + + + Spaghetti w/ Sauce + + + = Starch, Colored + + + + + : Product Outperformed by Grove detergent = : Product performed comparably with Grove detergent – : Product performed in a superior manner to Grove detergent Note: 1. Based on results from independent lab tests via ASTM D3556 - 85. Product performance was measured against “tough and greasy” food residue as determined by the independent lab
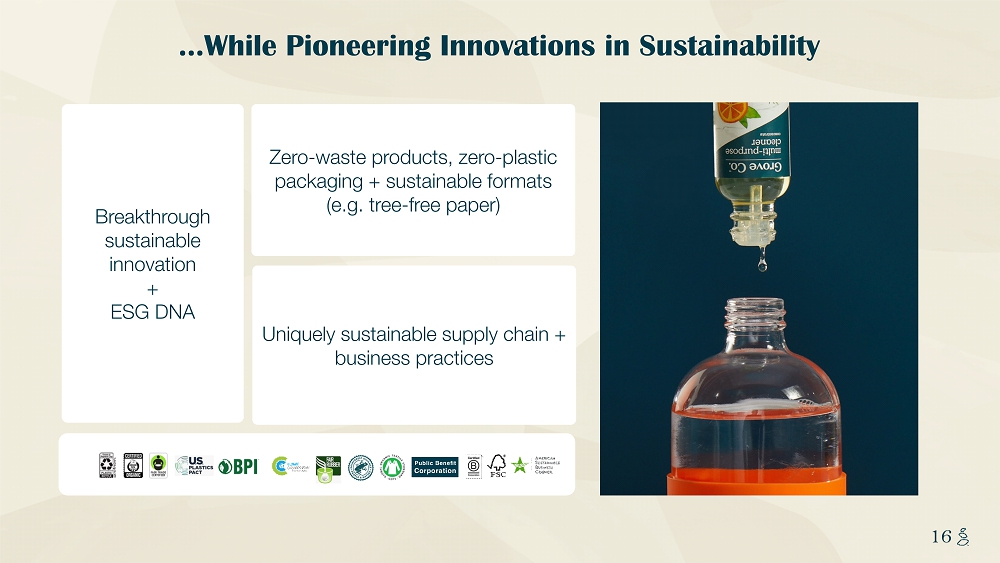
NOTES START FROM HERE AND GROW UP CONTENT BELOW THIS LINE CONTENT BELOW THIS LINE SUBTITLE BELOW THIS LINE TITLE CAN NOT GO ABOVE THIS LINE 16 16 Breakthrough sustainable innovation + ESG DNA Uniquely sustainable supply chain + business practices Zero - waste products, zero - plastic packaging + sustainable formats (e.g. tree - free paper) …While Pioneering Innovations in Sustainability
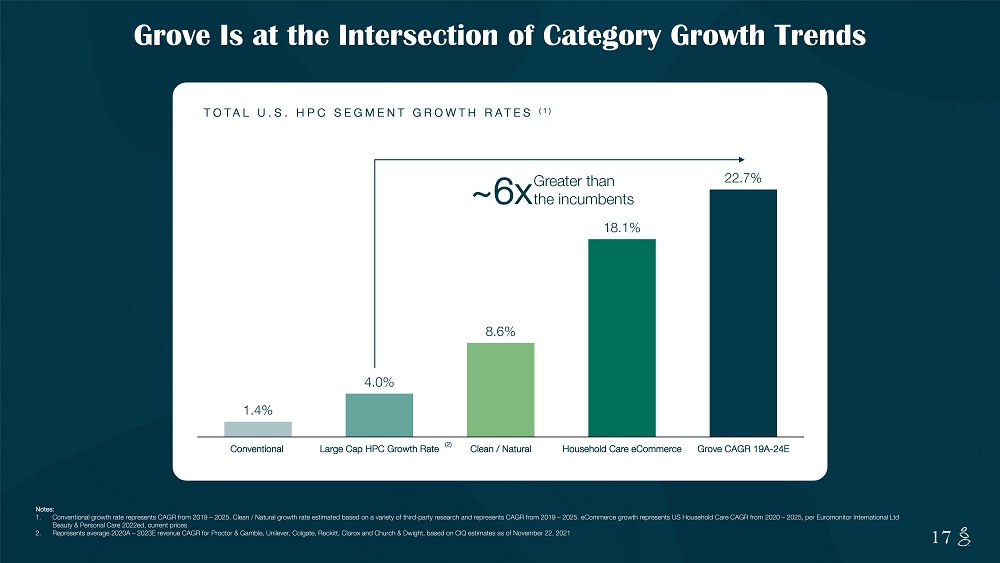
NOTES START FROM HERE AND GROW UP CONTENT BELOW THIS LINE CONTENT BELOW THIS LINE SUBTITLE BELOW THIS LINE TITLE CAN NOT GO ABOVE THIS LINE 17 17 1.4% 4.0% 8.6% 18.1% 22.7% Conventional Large Cap HPC Growth Rate Clean / Natural Household Care eCommerce Grove CAGR 19A-24E Greater than the incumbents ~6x TOTAL U.S. HPC SEGMENT GROWTH RATES (1) Grove Is at the Intersection of Category Growth Trends Notes: 1. Conventional growth rate represents CAGR from 2019 – 2025. Clean / Natural growth rate estimated based on a variety of third - par ty research and represents CAGR from 2019 – 2025. eCommerce growth represents US Household Care CAGR from 2020 – 2025, per Euromonitor International Ltd Beauty & Personal Care 2022ed, current prices 2. Represents average 2020A – 2023E revenue CAGR for Proctor & Gamble, Unilever, Colgate, Reckitt, Clorox and Church & Dwight, base d on CIQ estimates as of November 22, 2021 (2)
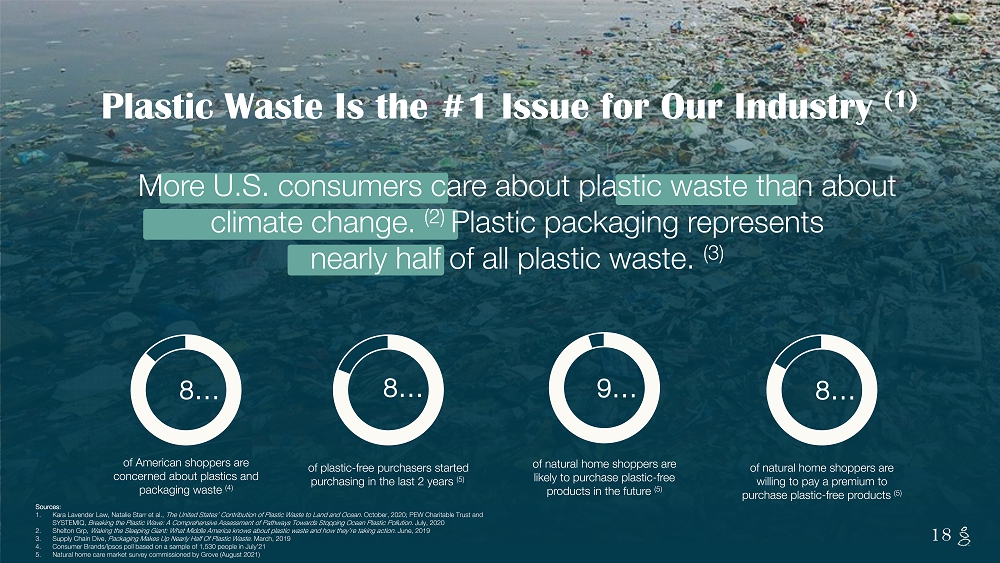
NOTES START FROM HERE AND GROW UP CONTENT BELOW THIS LINE CONTENT BELOW THIS LINE SUBTITLE BELOW THIS LINE TITLE CAN NOT GO ABOVE THIS LINE 18 18 More U.S. consumers care about plastic waste than about climate change. (2) Plastic packaging represents nearly half of all plastic waste. (3) 18 of plastic - free purchasers started purchasing in the last 2 years (5) 8 … of American shoppers are concerned about plastics and packaging waste (4) 8 … of natural home shoppers are willing to pay a premium to purchase plastic - free products (5) 8 … of natural home shoppers are likely to purchase plastic - free products in the future (5) 9 … Plastic Waste Is the #1 Issue for Our Industry (1) Sources: 1. Kara Lavender Law, Natalie Starr et al., The United States’ Contribution of Plastic Waste to Land and Ocean . October, 2020; PEW Charitable Trust and SYSTEMIQ, Breaking the Plastic Wave: A Comprehensive Assessment of Pathways Towards Stopping Ocean Plastic Pollution. July, 2020 2. Shelton Grp, Waking the Sleeping Giant: What Middle America knows about plastic waste and how they’re taking action. June, 2019 3. Supply Chain Dive, Packaging Makes Up Nearly Half Of Plastic Waste . March, 2019 4. Consumer Brands/Ipsos poll based on a sample of 1,530 people in July’21 5. Natural home care market survey commissioned by Grove (August 2021)
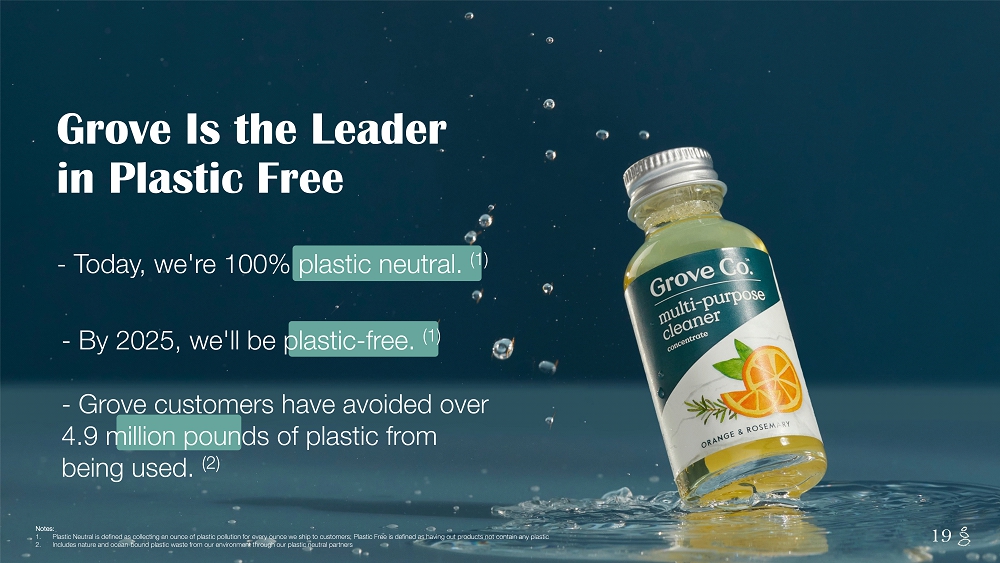
NOTES START FROM HERE AND GROW UP CONTENT BELOW THIS LINE CONTENT BELOW THIS LINE SUBTITLE BELOW THIS LINE TITLE CAN NOT GO ABOVE THIS LINE 19 - Grove customers have avoided over 4.9 million pounds of plastic from being used. (2) - Today, we're 100% plastic neutral. (1) - By 2025, we'll be plastic - free. (1) Grove Is the Leader in Plastic Free 19 Notes: 1. Plastic Neutral is defined as collecting an ounce of plastic pollution for every ounce we ship to customers; Plastic Free is def ined as having out products not contain any plastic 2. Includes nature and ocean - bound plastic waste from our environment through our plastic neutral partners
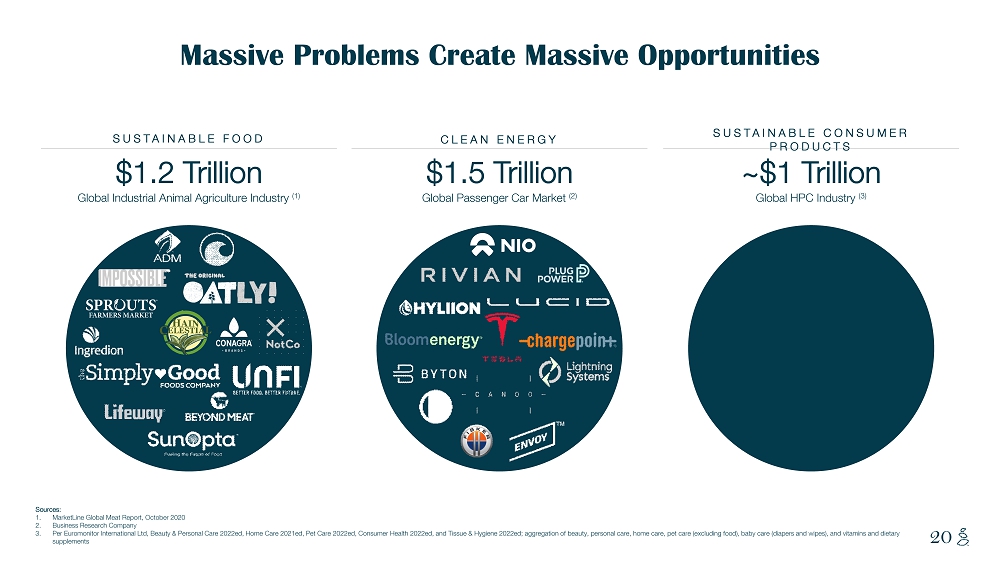
NOTES START FROM HERE AND GROW UP CONTENT BELOW THIS LINE CONTENT BELOW THIS LINE SUBTITLE BELOW THIS LINE TITLE CAN NOT GO ABOVE THIS LINE 20 Massive Problems Create Massive Opportunities Sources: 1. MarketLine Global Meat Report, October 2020 2. Business Research Company 3. Per Euromonitor International Ltd, Beauty & Personal Care 2022ed, Home Care 2021ed, Pet Care 2022ed, Consumer Health 2022ed, and Tissue & Hyg ie ne 2022ed; aggregation of beauty, personal care, home care, pet care (excluding food), baby care (diapers and wipes), and vit ami ns and dietary supplements $1.2 Trillion Global Industrial Animal Agriculture Industry (1) SUSTAINABLE FOOD $1.5 Trillion Global Passenger Car Market (2) CLEAN ENERGY ~$1 Trillion Global HPC Industry ( 3 ) SUSTAINABLE CONSUMER PRODUCTS
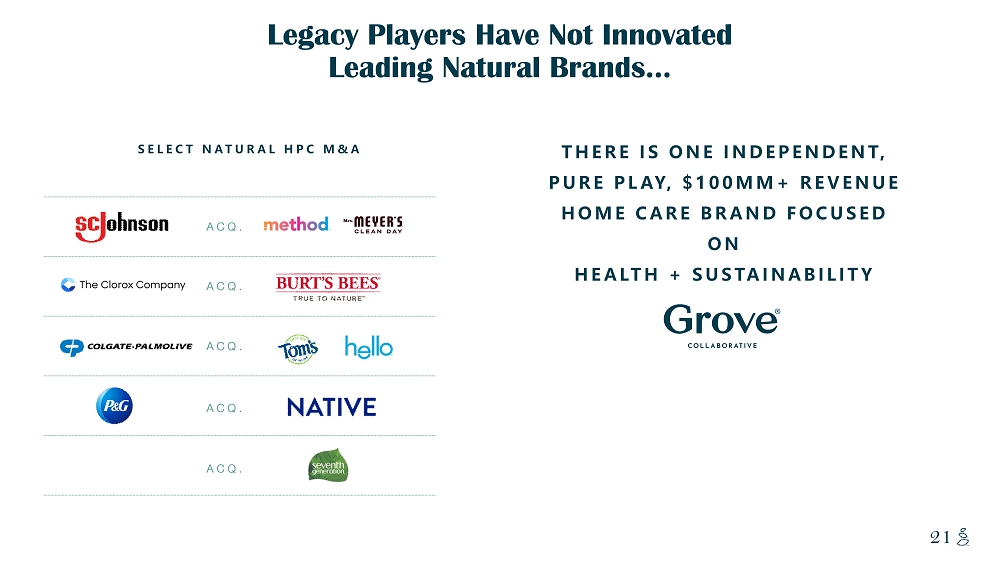
NOTES START FROM HERE AND GROW UP CONTENT BELOW THIS LINE CONTENT BELOW THIS LINE SUBTITLE BELOW THIS LINE TITLE CAN NOT GO ABOVE THIS LINE 21 Legacy Players Have Not Innovated Leading Natural Brands… SELECT NATURAL HPC M&A ACQ. ACQ. ACQ. ACQ. ACQ. THERE IS ONE INDEPENDENT, PURE PLAY, $100MM+ REVENUE HOME CARE BRAND FOCUSED ON HEALTH + SUSTAINABILITY
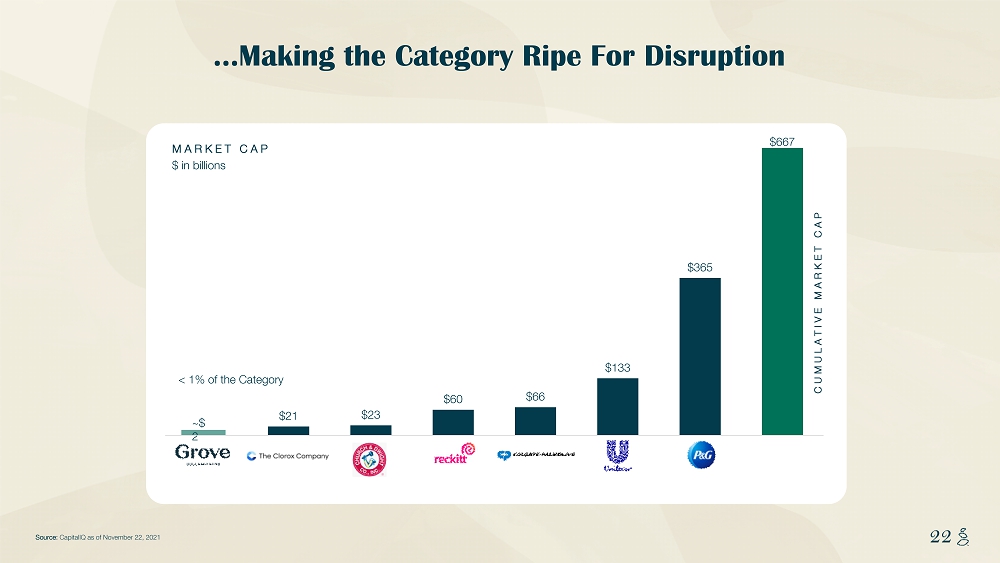
NOTES START FROM HERE AND GROW UP CONTENT BELOW THIS LINE CONTENT BELOW THIS LINE SUBTITLE BELOW THIS LINE TITLE CAN NOT GO ABOVE THIS LINE 22 22 Source: CapitalIQ as of November 22, 2021 < 1% of the Category MARKET CAP $ in billions …Making the Category Ripe For Disruption CUMULATIVE MARKET CAP ~$ 2 $21 $23 $60 $66 $133 $365 $667
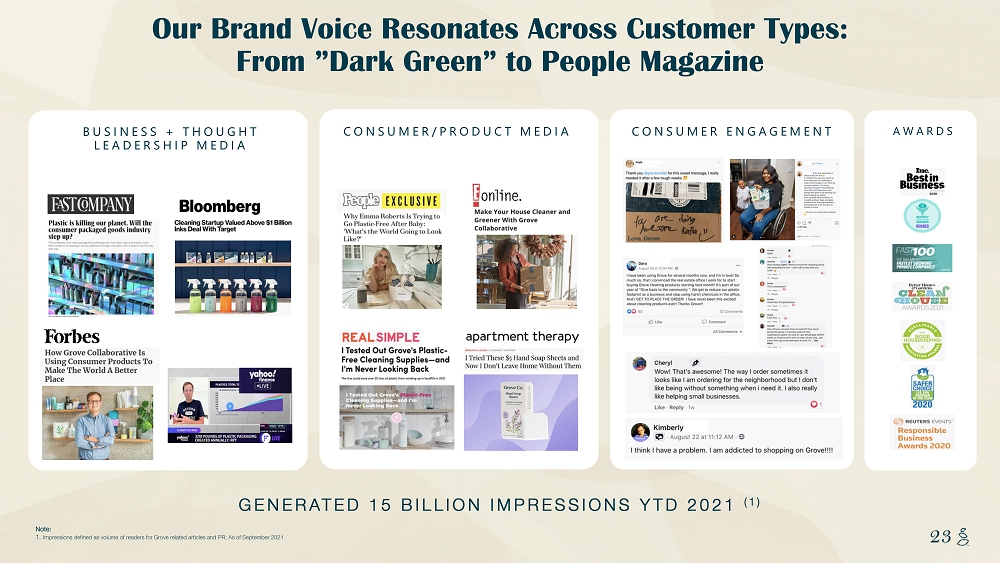
NOTES START FROM HERE AND GROW UP CONTENT BELOW THIS LINE CONTENT BELOW THIS LINE SUBTITLE BELOW THIS LINE TITLE CAN NOT GO ABOVE THIS LINE 23 23 Our Brand Voice Resonates Across Customer Types: From ”Dark Green” to People Magazine Note: 1. Impressions defined as volume of readers for Grove related articles and PR; As of September 2021 CONSUMER ENGAGEMENT AWARDS BUSINESS + THOUGHT LEADERSHIP MEDIA CONSUMER/PRODUCT MEDIA GENERATED 15 BILLION IMPRESSIONS YTD 2021 (1)
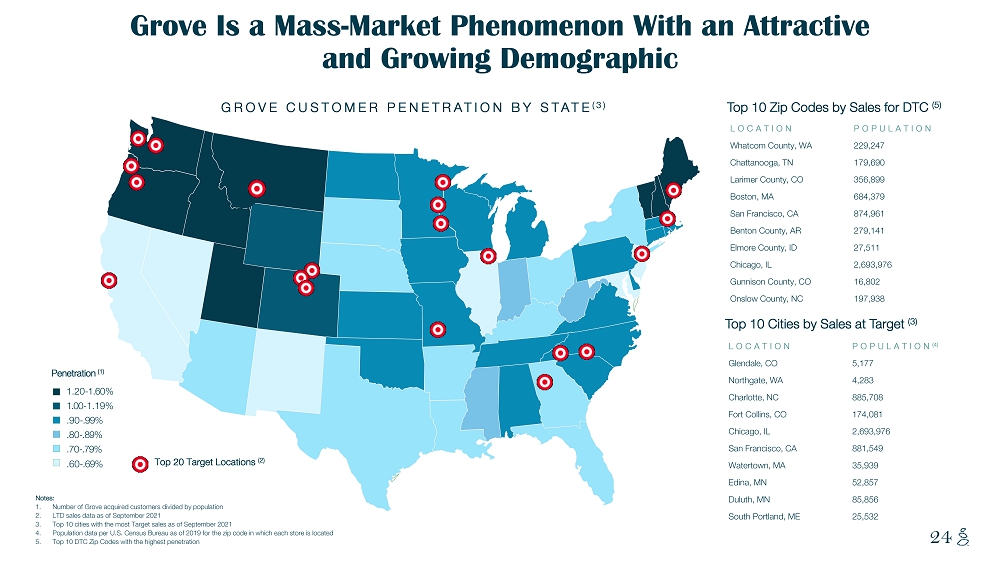
NOTES START FROM HERE AND GROW UP CONTENT BELOW THIS LINE CONTENT BELOW THIS LINE SUBTITLE BELOW THIS LINE TITLE CAN NOT GO ABOVE THIS LINE 24 Grove Is a Mass - Market Phenomenon With an Attractive and Growing Demographic Penetration (1) .60 - .69% .70 - .79% .80 - .89% .90 - .99% 1.00 - 1.19% 1.20 - 1.60 % Top 20 Target Locations (2) Notes: 1. Number of Grove acquired customers divided by population 2. LTD sales data as of September 2021 3. Top 10 cities with the most Target sales as of September 2021 4. Population data per U.S. Census Bureau as of 2019 for the zip code in which each store is located 5. Top 10 DTC Zip Codes with the highest penetration LOCATION POPULATION (4) Glendale, CO 5,177 Northgate, WA 4,283 Charlotte, NC 885,708 Fort Collins, CO 174,081 Chicago, IL 2,693,976 San Francisco, CA 881,549 Watertown, MA 35,939 Edina, MN 52,857 Duluth, MN 85,856 South Portland, ME 25,532 LOCATION POPULATION Whatcom County, WA 229,247 Chattanooga, TN 179,690 Larimer County, CO 356,899 Boston, MA 684,379 San Francisco, CA 874,961 Benton County, AR 279,141 Elmore County, ID 27,511 Chicago, IL 2,693,976 Gunnison County, CO 16,802 Onslow County, NC 197,938 Top 10 Zip Codes by Sales for DTC (5) Top 10 Cities by Sales at Target (3) GROVE CUSTOMER PENETRATION BY STATE (3)
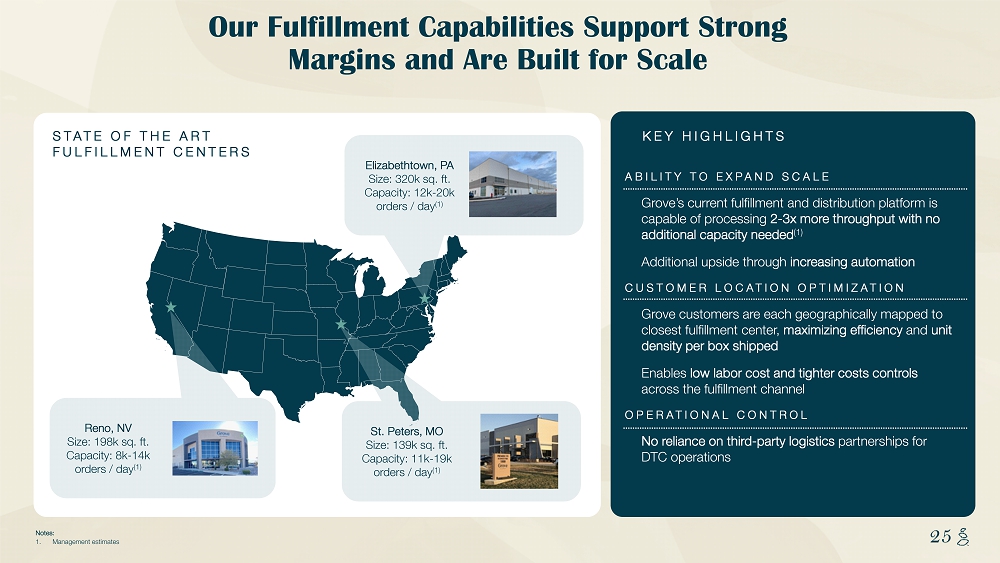
NOTES START FROM HERE AND GROW UP CONTENT BELOW THIS LINE CONTENT BELOW THIS LINE SUBTITLE BELOW THIS LINE TITLE CAN NOT GO ABOVE THIS LINE 25 25 ABILITY TO EXPAND SCALE Grove’s current fulfillment and distribution platform is capable of processing 2 - 3x more throughput with no additional capacity needed (1) Additional upside through increasing automation CUSTOMER LOCATION OPTIMIZATION Grove customers are each geographically mapped to closest fulfillment center, maximizing efficiency and unit density per box shipped Enables low labor cost and tighter costs controls across the fulfillment channel OPERATIONAL CONTROL No reliance on third - party logistics partnerships for DTC operations Our Fulfillment Capabilities Support Strong Margins and Are Built for Scale St. Peters, MO Size: 139k sq. ft. Capacity: 11k - 19k orders / day (1) Elizabethtown, PA Size: 320k sq. ft. Capacity: 12k - 20k orders / day (1) Reno, NV Size: 198k sq. ft. Capacity: 8k - 14k orders / day (1) KEY HIGHLIGHTS STATE OF THE ART FULFILLMENT CENTERS Notes: 1. Management estimates
NOTES START FROM HERE AND GROW UP CONTENT BELOW THIS LINE CONTENT BELOW THIS LINE SUBTITLE BELOW THIS LINE TITLE CAN NOT GO ABOVE THIS LINE 26 SECTION 2 Repeatable, Differentiated Innovation Is Our Outgrowth Algorithm 26
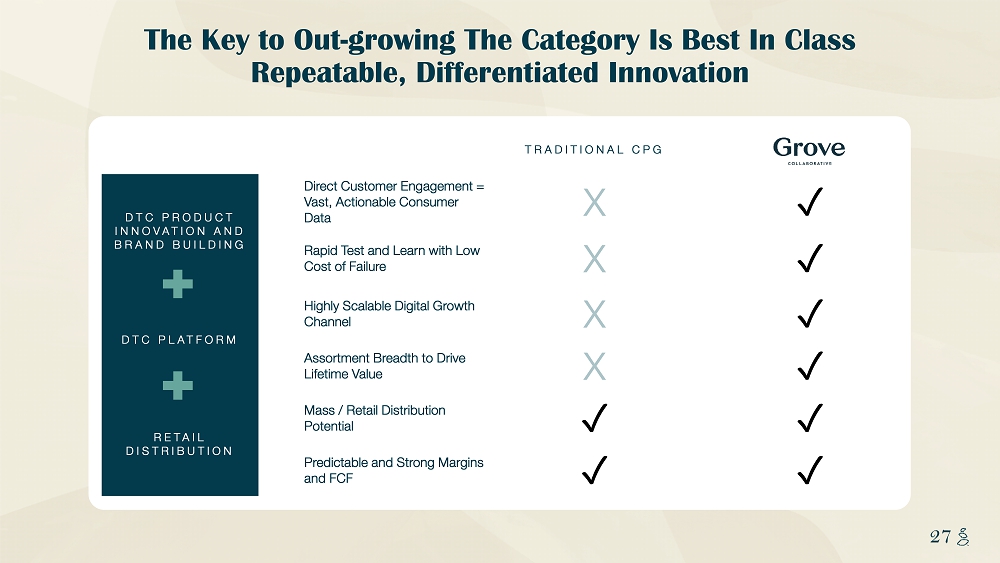
NOTES START FROM HERE AND GROW UP CONTENT BELOW THIS LINE CONTENT BELOW THIS LINE SUBTITLE BELOW THIS LINE TITLE CAN NOT GO ABOVE THIS LINE 27 27 TRADITIONAL CPG DTC PRODUCT INNOVATION AND BRAND BUILDING Direct Customer Engagement = Vast, Actionable Consumer Data X ✓ Rapid Test and Learn with Low Cost of Failure X ✓ DTC PLATFORM Highly Scalable Digital Growth Channel X ✓ Assortment Breadth to Drive Lifetime Value X ✓ RETAIL DISTRIBUTION Mass / Retail Distribution Potential ✓ ✓ Predictable and S trong Margins and FCF ✓ ✓ The Key to Out - growing The Category Is Best In Class Repeatable, Differentiated Innovation
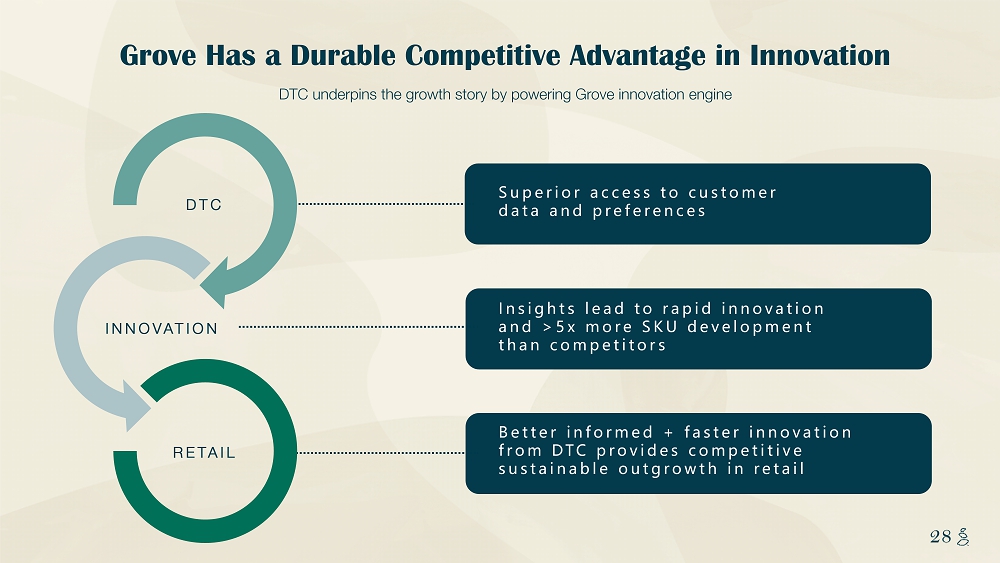
NOTES START FROM HERE AND GROW UP CONTENT BELOW THIS LINE CONTENT BELOW THIS LINE SUBTITLE BELOW THIS LINE TITLE CAN NOT GO ABOVE THIS LINE 28 28 Superior access to customer data and preferences Insights lead to rapid innovation and > 5x more SKU development than competitors Better informed + faster innovation from DTC provides competitive sustainable outgrowth in retail DTC underpins the growth story by powering Grove innovation engine Grove Has a Durable Competitive Advantage in Innovation DTC INNOVATION RETAIL
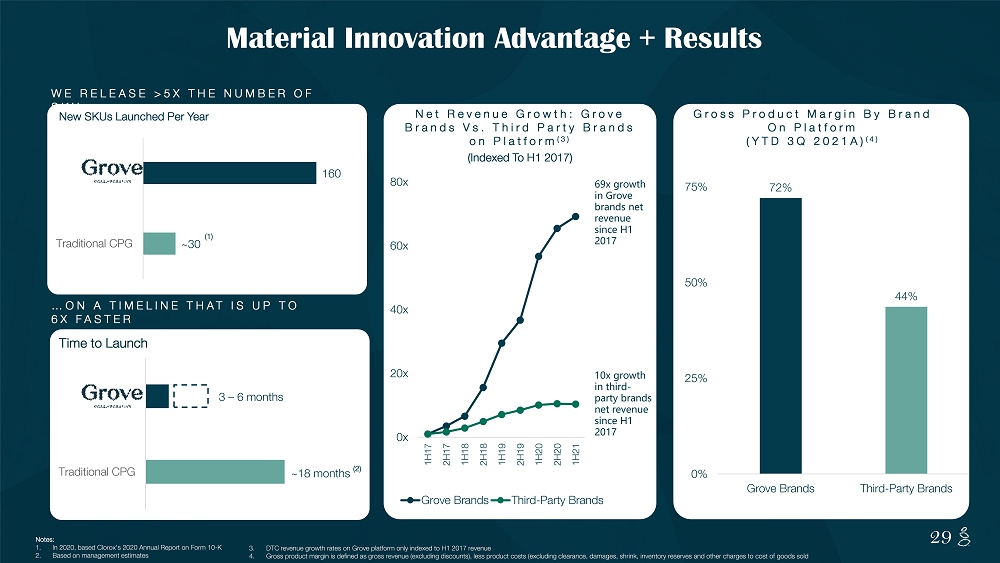
NOTES START FROM HERE AND GROW UP CONTENT BELOW THIS LINE CONTENT BELOW THIS LINE SUBTITLE BELOW THIS LINE TITLE CAN NOT GO ABOVE THIS LINE 29 29 WE RELEASE >5X THE NUMBER OF SKU s … Material Innovation Advantage + Results Notes: 1. In 2020, based Clorox's 2020 Annual Report on Form 10 - K 2. Based on management estimates 3. DTC revenue growth rates on Grove platform only indexed to H1 2017 revenue 4. Gross product margin is defined as gross revenue (excluding discounts), less product costs (excluding clearance, damages, shr ink , inventory reserves and other charges to cost of goods sold …ON A TIMELINE THAT IS UP TO 6X FASTER Time to Launch ~ 30 160 Traditional CPG New SKUs Launched Per Year ~ 18 months Traditional CPG 3 – 6 months Net Revenue Growth: Grove Brands Vs. Third Party Brands on Platform (3) (Indexed To H1 2017) 0x 20x 40x 60x 80x 1H17 2H17 1H18 2H18 1H19 2H19 1H20 2H20 1H21 Grove Brands Third-Party Brands 69x growth in Grove brands net revenue since H1 2017 10x growth in third - party brands net revenue since H1 2017 Gross Product Margin By Brand On Platform (YTD 3Q 2021A) (4) 72% 44% 0% 25% 50% 75% Grove Brands Third-Party Brands (2) (1)
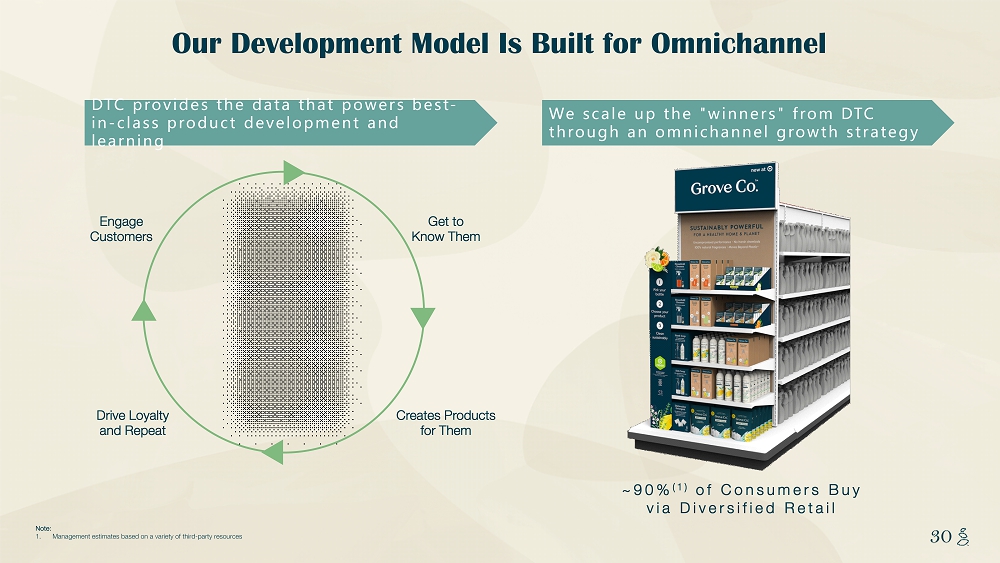
NOTES START FROM HERE AND GROW UP CONTENT BELOW THIS LINE CONTENT BELOW THIS LINE SUBTITLE BELOW THIS LINE TITLE CAN NOT GO ABOVE THIS LINE 30 30 Note: 1. Management estimates based on a variety of third - party resources Engage Customers Get to Know Them Creates Products for Them Drive Loyalty and Repeat We scale up the "winners" from DTC through an omnichannel growth strategy DTC provides the data that powers best - in - class product development and learning Our Development Model Is Built for Omnichannel ~90% (1) of Consumers Buy via Diversified Retail
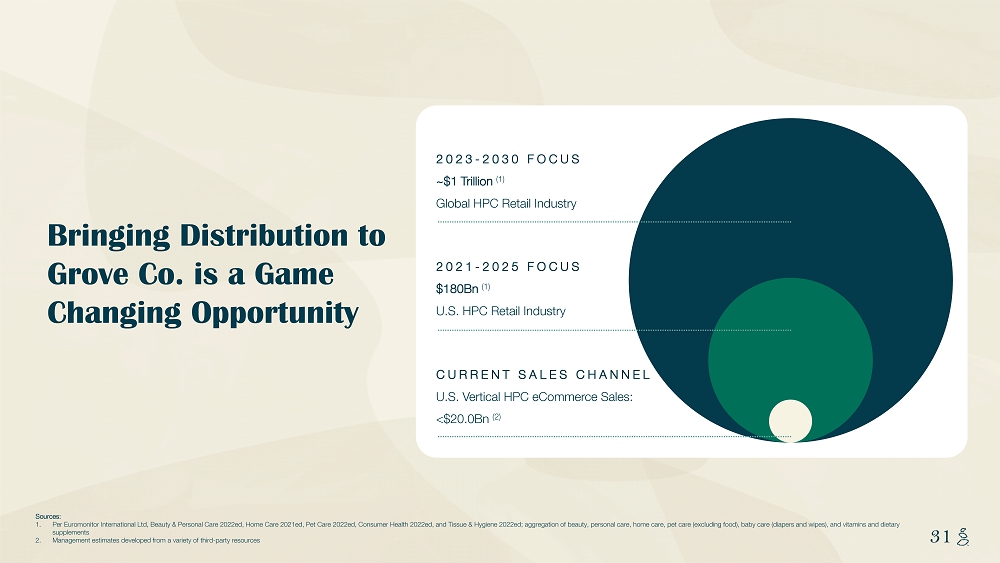
NOTES START FROM HERE AND GROW UP CONTENT BELOW THIS LINE CONTENT BELOW THIS LINE SUBTITLE BELOW THIS LINE TITLE CAN NOT GO ABOVE THIS LINE 31 31 Bringing Distribution to Grove Co. is a Game Changing Opportunity Sources: 1. Per Euromonitor International Ltd, Beauty & Personal Care 2022ed, Home Care 2021ed, Pet Care 2022ed, Consumer Health 2022ed, and Tissue & Hyg ie ne 2022ed; aggregation of beauty, personal care, home care, pet care (excluding food), baby care (diapers and wipes), and vit ami ns and dietary supplements 2. Management estimates developed from a variety of third - party resources CURRENT SALES CHANNEL U.S. Vertical HPC eCommerce Sales: <$20.0Bn (2) 2021 - 2025 FOCUS $180Bn (1) U.S. HPC Retail Industry 2023 - 2030 FOCUS ~$1 Trillion (1) Global HPC Retail Industry
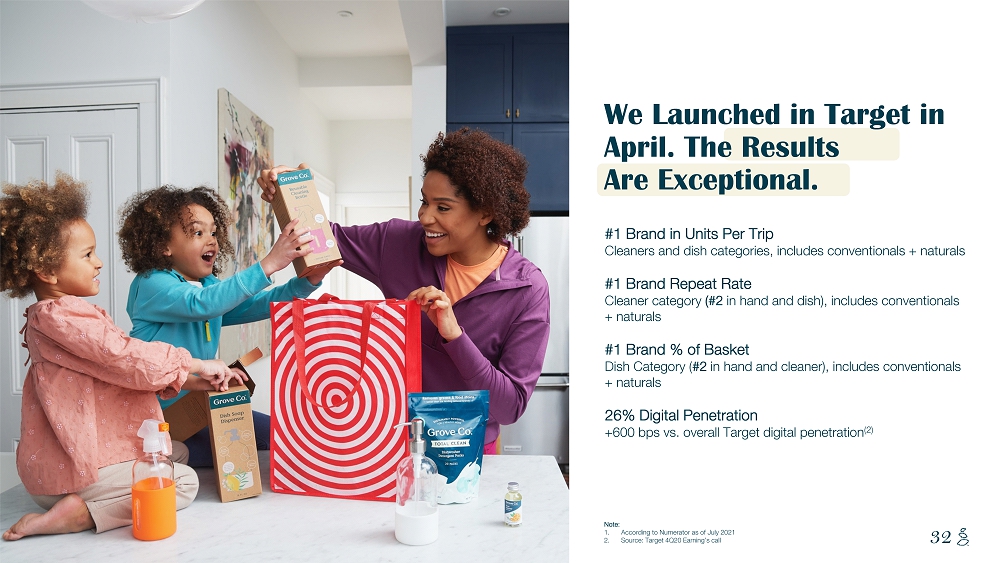
NOTES START FROM HERE AND GROW UP CONTENT BELOW THIS LINE CONTENT BELOW THIS LINE SUBTITLE BELOW THIS LINE TITLE CAN NOT GO ABOVE THIS LINE 32 We Launched in Target in April. The Results Are Exceptional. #1 Brand in Units Per Trip Cleaners and dish categories, includes conventionals + naturals #1 Brand Repeat Rate Cleaner category (#2 in hand and dish), includes conventionals + naturals #1 Brand % of Basket Dish Category ( #2 in hand and cleaner), includes conventionals + naturals 26% Digital Penetration +600 bps vs. overall Target digital penetration (2) Note: 1. According to Numerator as of July 2021 2. Source: Target 4Q20 Earning’s call
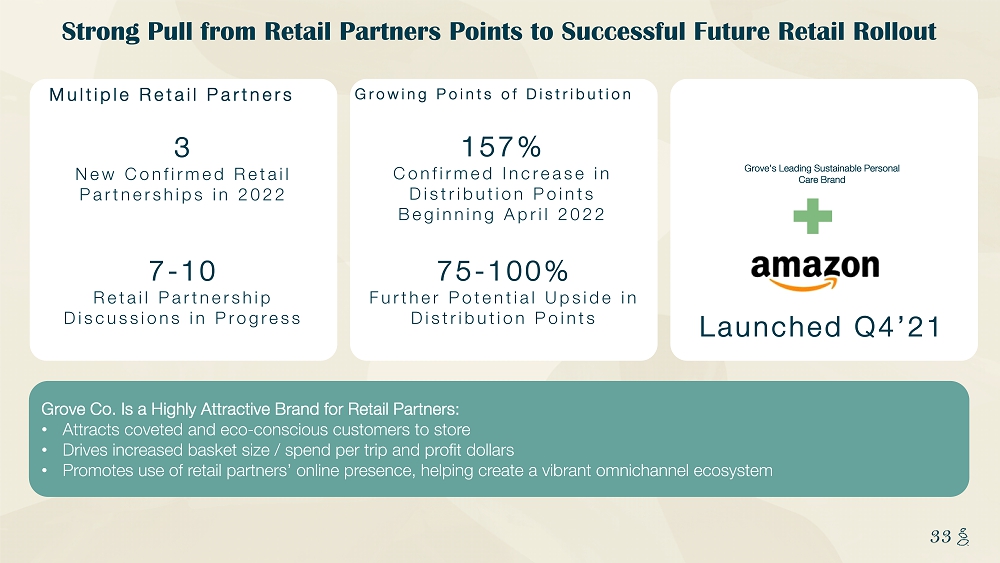
NOTES START FROM HERE AND GROW UP CONTENT BELOW THIS LINE CONTENT BELOW THIS LINE SUBTITLE BELOW THIS LINE TITLE CAN NOT GO ABOVE THIS LINE 33 33 Strong Pull from Retail Partners Points to Successful Future Retail Rollout Grove Co. Is a Highly Attractive Brand for Retail Partners: • Attracts coveted and eco - conscious customers to store • Drives increased basket size / spend per trip and profit dollars • Promotes use of retail partners’ online presence, helping create a vibrant omnichannel ecosystem Multiple Retail Partners 3 New Confirmed Retail Partnerships in 2022 7 - 10 Retail Partnership Discussions in Progress Growing Points of Distribution 157% Confirmed Increase in Distribution Points Beginning April 2022 75 - 100% Further Potential Upside in Distribution Points Launched Q4’21 Grove’s Leading Sustainable Personal Care Brand
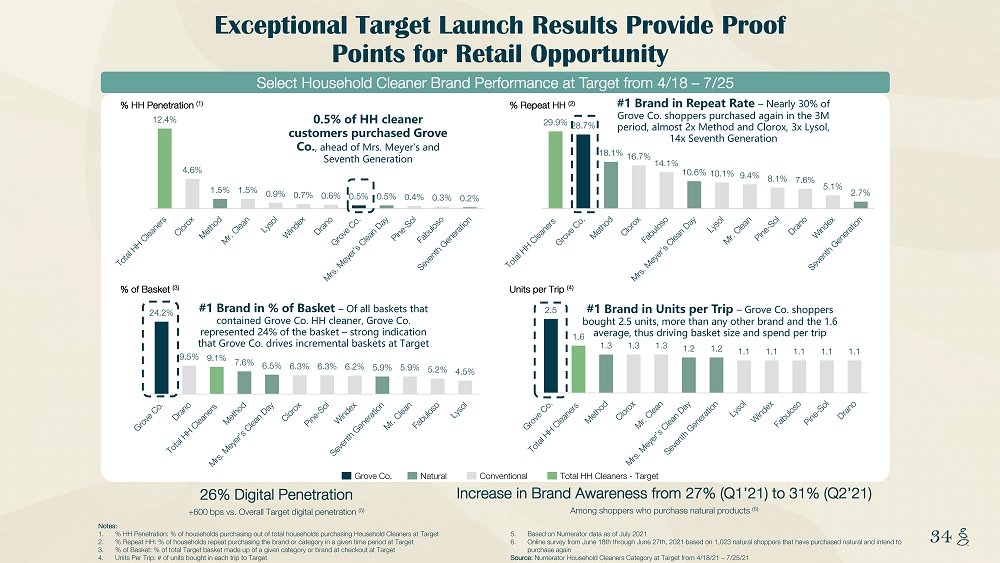
NOTES START FROM HERE AND GROW UP CONTENT BELOW THIS LINE CONTENT BELOW THIS LINE SUBTITLE BELOW THIS LINE TITLE CAN NOT GO ABOVE THIS LINE 34 34 Exceptional Target Launch Results Provide Proof Points for Retail Opportunity Notes: 1. % HH Penetration: % of households purchasing out of total households purchasing Household Cleaners at Target 2. % Repeat HH: % of households repeat purchasing the brand or category in a given time period at Target 3. % of Basket: % of total Target basket made up of a given category or brand at checkout at Target 4. Units Per Trip: # of units bought in each trip to Target 5. Based on Numerator data as of July 2021 6. Online survey from June 18th through June 27th, 2021 based on 1,023 natural shoppers that have purchased natural and intend t o purchase again Source: Numerator Household Cleaners Category at Target from 4/18/21 – 7/25/21 12.4% 4.6% 1.5% 1.5% 0.9% 0.7% 0.6% 0.5% 0.5% 0.4% 0.3% 0.2% % HH Penetration (1) % Repeat HH (2) % of Basket (3) Units per Trip (4) 29.9% 28.7% 18.1% 16.7% 14.1% 10.6% 10.1% 9.4% 8.1% 7.6% 5.1% 2.7% 2.5 1.6 1.3 1.3 1.3 1.2 1.2 1.1 1.1 1.1 1.1 1.1 24.2% 9.5% 9.1% 7.6% 6.5% 6.3% 6.3% 6.2% 5.9% 5.9% 5.2% 4.5% Grove Co. Natural Conventional Total HH Cleaners - Target Select Household Cleaner Brand Performance at Target from 4/18 – 7/25 0.5% of HH cleaner customers purchased Grove Co. , ahead of Mrs. Meyer’s and Seventh Generation #1 Brand in Repeat Rate – Nearly 30% of Grove Co. shoppers purchased again in the 3M period, almost 2x Method and Clorox, 3x Lysol, 14x Seventh Generation #1 Brand in % of Basket – Of all baskets that contained Grove Co. HH cleaner, Grove Co. represented 24% of the basket – strong indication that Grove Co. drives incremental baskets at Target #1 Brand in Units per Trip – Grove Co. shoppers bought 2.5 units, more than any other brand and the 1.6 average, thus driving basket size and spend per trip 26% Digital Penetration +600 bps vs. Overall Target digital penetration (5) Increase in Brand Awareness from 27% (Q1’21) to 31% (Q2’21) Among shoppers who purchase natural products (6)

NOTES START FROM HERE AND GROW UP CONTENT BELOW THIS LINE CONTENT BELOW THIS LINE SUBTITLE BELOW THIS LINE TITLE CAN NOT GO ABOVE THIS LINE 35 SECTION 3 Loyal, High - Value Customers 35
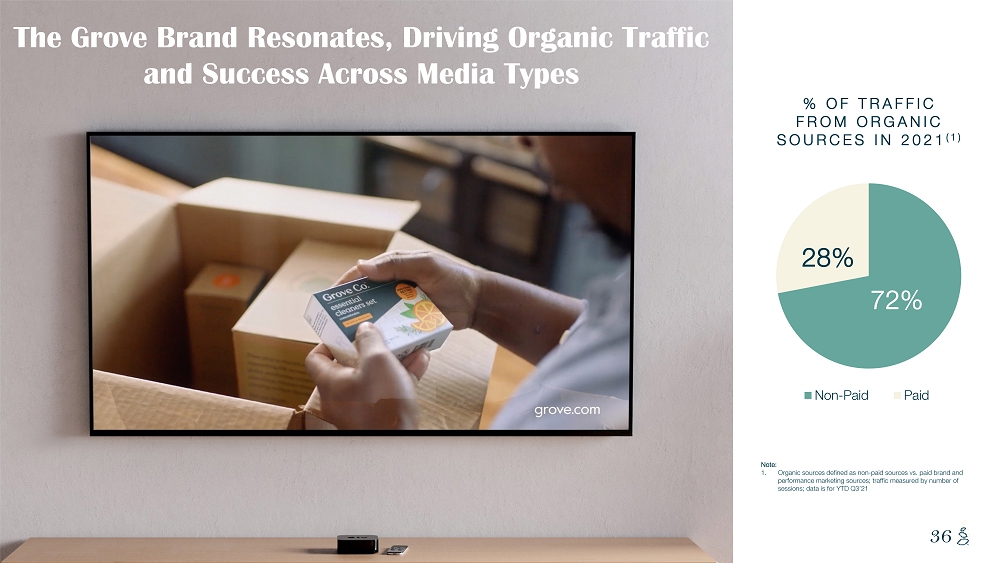
NOTES START FROM HERE AND GROW UP CONTENT BELOW THIS LINE CONTENT BELOW THIS LINE SUBTITLE BELOW THIS LINE TITLE CAN NOT GO ABOVE THIS LINE 36 36 % OF TRAFFIC FROM ORGANIC SOURCES IN 2021 (1) 72% 28% Non-Paid Paid The Grove Brand Resonates, Driving Organic Traffic and Success Across Media Types 36 36 Note: 1. Organic sources defined as non - paid sources vs. paid brand and performance marketing sources; traffic measured by number of sessions; data is for YTD Q3’21
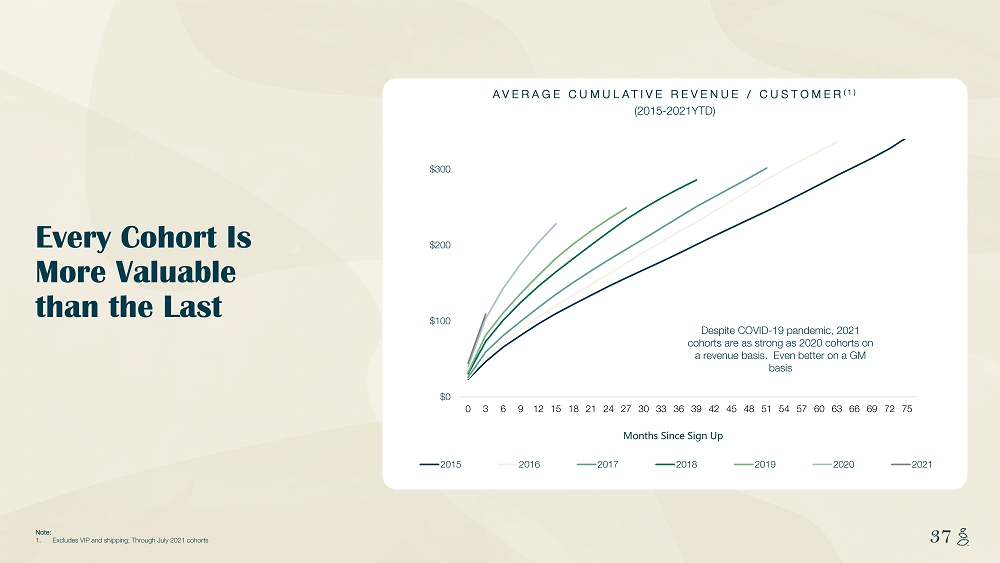
NOTES START FROM HERE AND GROW UP CONTENT BELOW THIS LINE CONTENT BELOW THIS LINE SUBTITLE BELOW THIS LINE TITLE CAN NOT GO ABOVE THIS LINE 37 37 Note: 1. Excludes VIP and shipping; Through July 2021 cohorts $0 $100 $200 $300 0 3 6 9 12 15 18 21 24 27 30 33 36 39 42 45 48 51 54 57 60 63 66 69 72 75 2015 2016 2017 2018 2019 2020 2021 AVERAGE CUMULATIVE REVENUE / CUSTOMER (1) (2015 - 2021YTD) Despite COVID - 19 pandemic, 2021 cohorts are as strong as 2020 cohorts on a revenue basis. Even better on a GM basis Months Since Sign Up Every Cohort Is More Valuable than the Last MS - Stretch the chart vertically
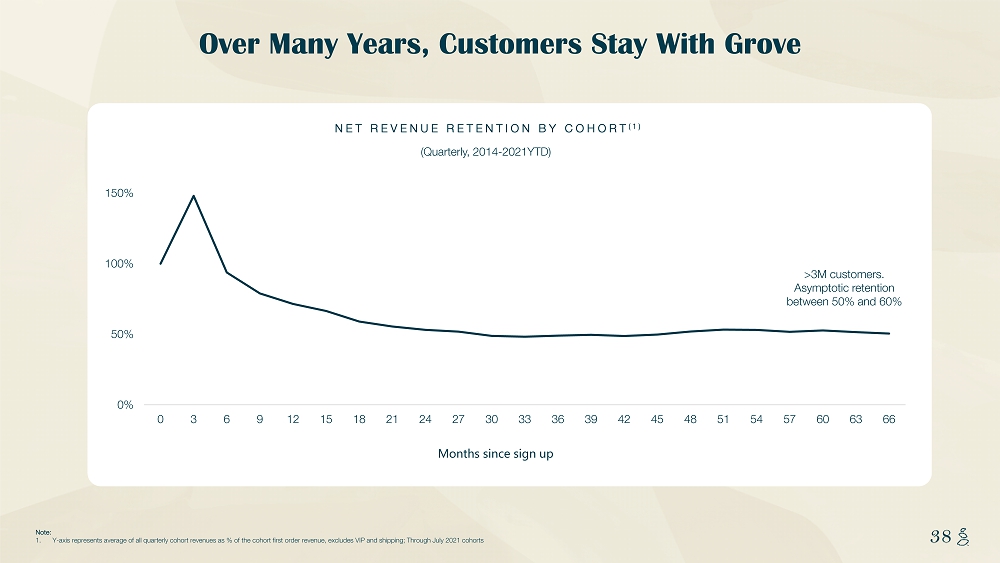
NOTES START FROM HERE AND GROW UP CONTENT BELOW THIS LINE CONTENT BELOW THIS LINE SUBTITLE BELOW THIS LINE TITLE CAN NOT GO ABOVE THIS LINE 38 38 0% 50% 100% 150% 0 3 6 9 12 15 18 21 24 27 30 33 36 39 42 45 48 51 54 57 60 63 66 Months since sign up Note: 1. Y - axis represents average of all quarterly cohort revenues as % of the cohort first order revenue, excludes VIP and shipping; T h rough July 2021 cohorts NET REVENUE RETENTION BY COHORT (1) (Quarterly, 2014 - 2021YTD) Over Many Years, Customers Stay With Grove > 3 M customers. Asymptotic retention between 50% and 60%
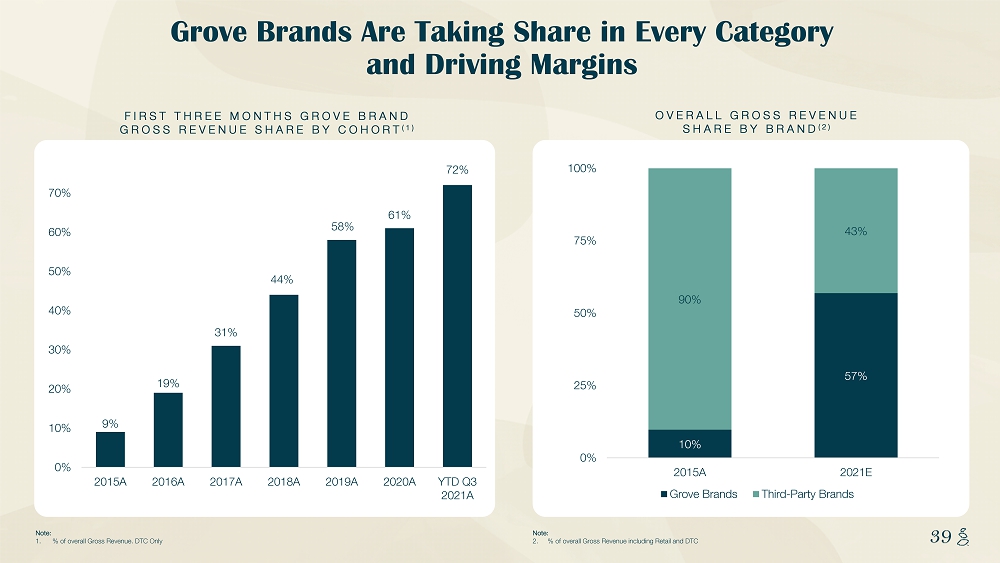
NOTES START FROM HERE AND GROW UP CONTENT BELOW THIS LINE CONTENT BELOW THIS LINE SUBTITLE BELOW THIS LINE TITLE CAN NOT GO ABOVE THIS LINE 39 39 Note: 1. % of overall Gross Revenue. DTC Only FIRST THREE MONTHS GROVE BRAND GROSS REVENUE SHARE BY COHORT (1 ) 9% 19% 31% 44% 58% 61% 72% 0% 10% 20% 30% 40% 50% 60% 70% 2015A 2016A 2017A 2018A 2019A 2020A YTD Q3 2021A Grove Brands Are Taking Share in Every Category and Driving Margins OVERALL GROSS REVENUE SHARE BY BRAND (2 ) 10% 57% 90% 43% 0% 25% 50% 75% 100% 2015A 2021E Grove Brands Third-Party Brands Note: 2. % of overall Gross Revenue including Retail and DTC
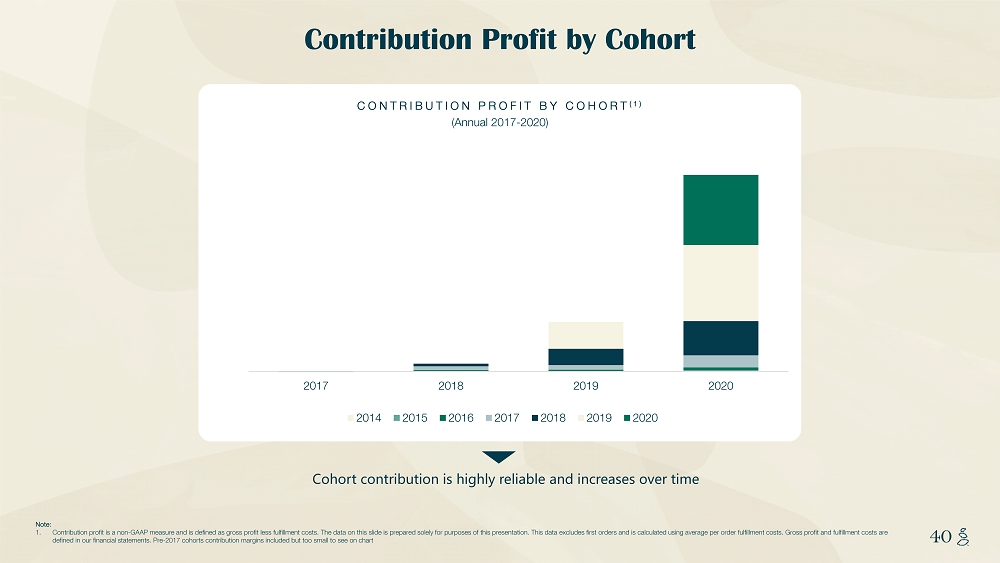
NOTES START FROM HERE AND GROW UP CONTENT BELOW THIS LINE CONTENT BELOW THIS LINE SUBTITLE BELOW THIS LINE TITLE CAN NOT GO ABOVE THIS LINE 40 40 Note: 1. Contribution profit is a non - GAAP measure and is defined as gross profit less fulfillment costs. The data on this slide is prepa red solely for purposes of this presentation. This data excludes first orders and is calculated using average per order fulfi llm ent costs. Gross profit and fulfillment costs are defined in our financial statements. Pre - 2017 cohorts contribution margins included but too small to see on chart Cohort contribution is highly reliable and increases over time CONTRIBUTION PROFIT BY COHORT (1) (Annual 2017 - 2020) $0 $20 $40 $60 $80 $100 2017 2018 2019 2020 2014 2015 2016 2017 2018 2019 2020 Contribution Profit by Cohort
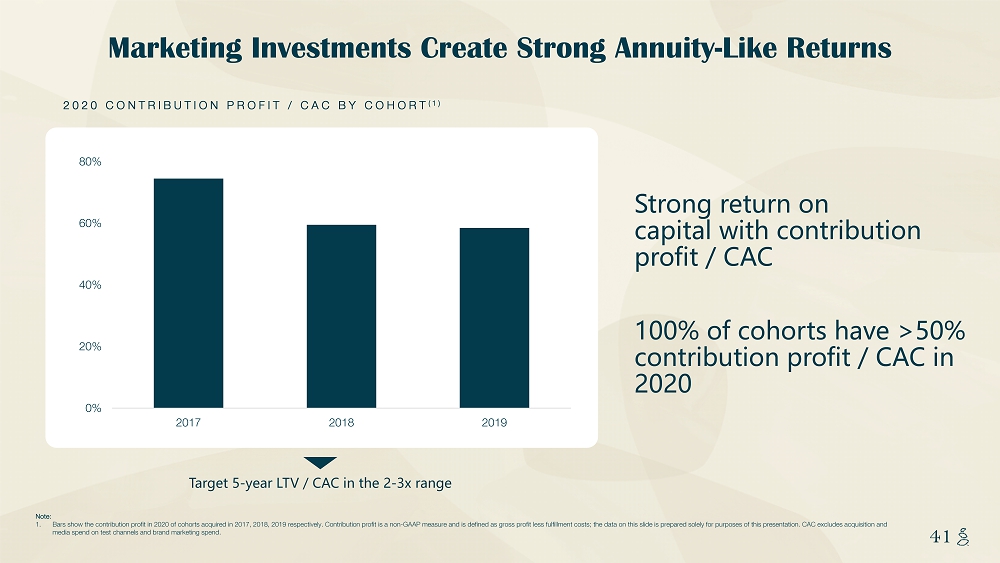
NOTES START FROM HERE AND GROW UP CONTENT BELOW THIS LINE CONTENT BELOW THIS LINE SUBTITLE BELOW THIS LINE TITLE CAN NOT GO ABOVE THIS LINE 41 41 0% 20% 40% 60% 80% 2017 2018 2019 2020 CONTRIBUTION PROFIT / CAC BY COHORT (1) Note: 1. Bars show the contribution profit in 2020 of cohorts acquired in 2017, 2018, 2019 respectively. Contribution profit is a non - GAA P measure and is defined as gross profit less fulfillment costs; the data on this slide is prepared solely for purposes of th is presentation. CAC excludes acquisition and media spend on test channels and brand marketing spend. Target 5 - year LTV / CAC in the 2 - 3x range Marketing Investments Create Strong Annuity - Like Returns Strong return on capital with contribution profit / CAC 100% of cohorts have >50% contribution profit / CAC in 2020
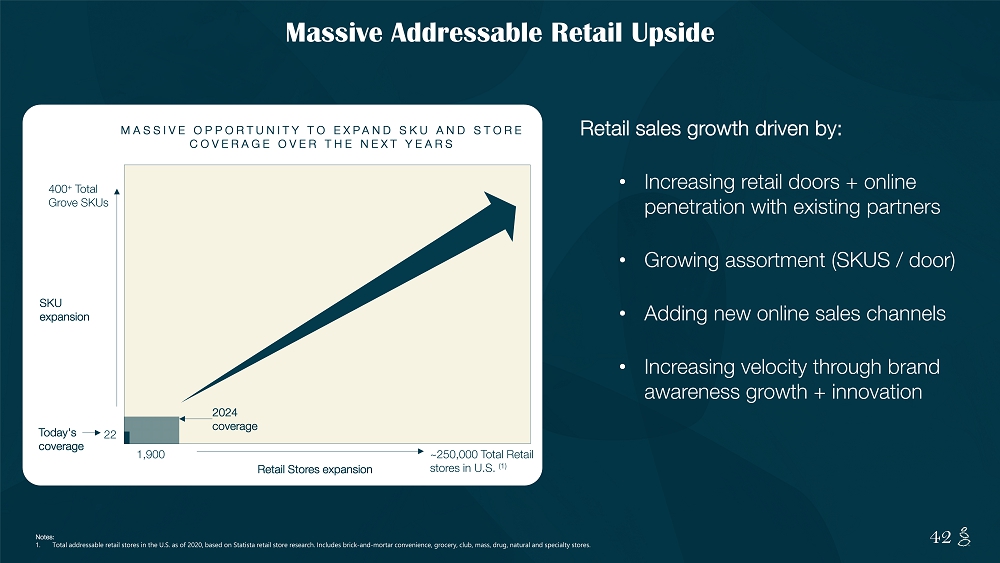
NOTES START FROM HERE AND GROW UP CONTENT BELOW THIS LINE CONTENT BELOW THIS LINE SUBTITLE BELOW THIS LINE TITLE CAN NOT GO ABOVE THIS LINE 42 42 Massive Addressable Retail Upside Retail Stores expansion SKU expansion MASSIVE OPPORTUNITY TO EXPAND SKU AND STORE COVERAGE OVER THE NEXT YEARS ~250,000 Total Retail stores in U.S. (1) 1,900 400 + Total Grove SKUs Today's coverage 22 Notes: 1. Total addressable retail stores in the U.S. as of 2020, based on Statista retail store research. Includes brick - and - mortar conve nience, grocery, club, mass, drug, natural and specialty stores. 2024 coverage Retail sales growth driven by: • Increasing retail doors + online penetration with existing partners • Growing assortment (SKUS / door) • Adding new online sales channels • Increasing velocity through brand awareness growth + innovation

NOTES START FROM HERE AND GROW UP CONTENT BELOW THIS LINE CONTENT BELOW THIS LINE SUBTITLE BELOW THIS LINE TITLE CAN NOT GO ABOVE THIS LINE 43 43 SECTION 4 Financials 43
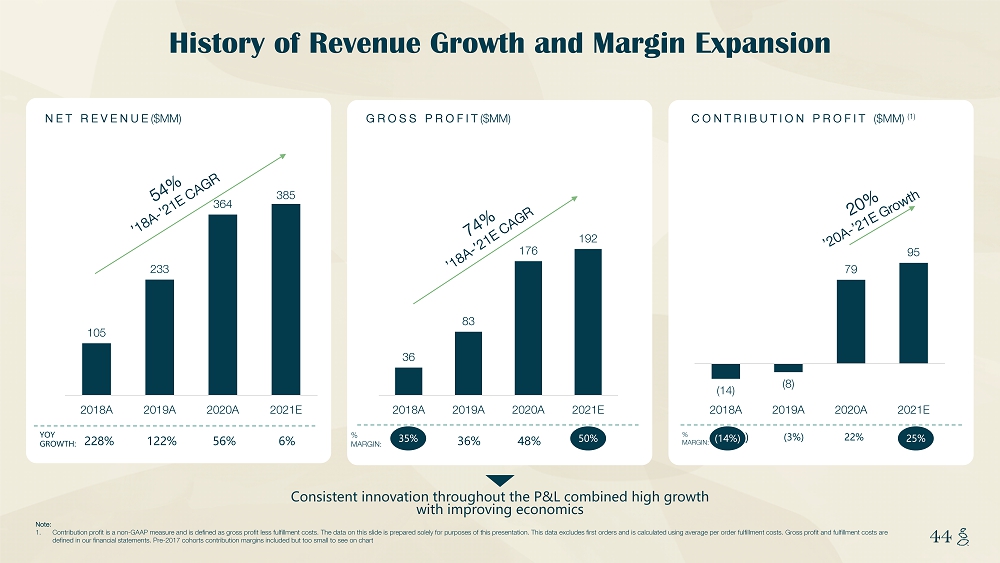
NOTES START FROM HERE AND GROW UP CONTENT BELOW THIS LINE CONTENT BELOW THIS LINE SUBTITLE BELOW THIS LINE TITLE CAN NOT GO ABOVE THIS LINE 44 44 NET REVENUE ($MM) History of Revenue Growth and Margin Expansion GROSS PROFIT ($MM) CONTRIBUTION PROFIT ($MM) (1) Consistent innovation throughout the P&L combined high growth with improving economics 228% 122% 56% 6 % YOY GROWTH: 35% 36% 48% 50 % % MARGIN: (14%) (3%) 22% 25 % % MARGIN: (14 %) 25 % Note: 1. Contribution profit is a non - GAAP measure and is defined as gross profit less fulfillment costs. The data on this slide is prepa red solely for purposes of this presentation. This data excludes first orders and is calculated using average per order fulfi llm ent costs. Gross profit and fulfillment costs are defined in our financial statements. Pre - 2017 cohorts contribution margins included but too small to see on chart 105 233 364 385 2018A 2019A 2020A 2021E 36 83 176 192 2018A 2019A 2020A 2021E (14) (8) 79 95 2018A 2019A 2020A 2021E
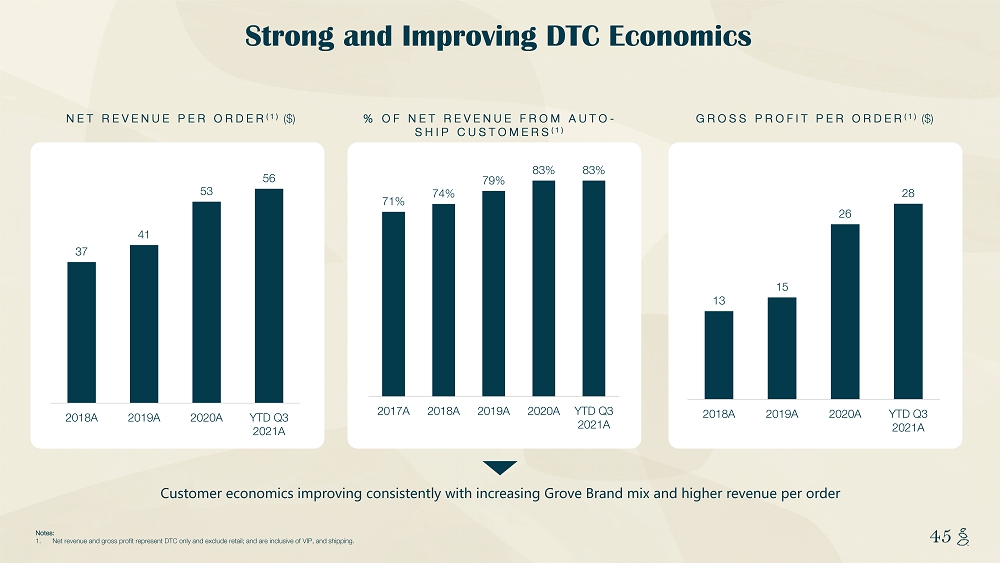
NOTES START FROM HERE AND GROW UP CONTENT BELOW THIS LINE CONTENT BELOW THIS LINE SUBTITLE BELOW THIS LINE TITLE CAN NOT GO ABOVE THIS LINE 45 45 Strong and Improving DTC Economics NET REVENUE PER ORDER (1) ($) Customer economics improving consistently with increasing Grove Brand mix and higher revenue per order Notes: 1. Net revenue and gross profit represent DTC only and exclude retail; and are inclusive of VIP, and shipping. % OF NET REVENUE FROM AUTO - SHIP CUSTOMERS (1) 71% 74% 79% 83% 83% 2017A 2018A 2019A 2020A YTD Q3 2021A GROSS PROFIT PER ORDER (1) ($) 37 41 53 56 2018A 2019A 2020A YTD Q3 2021A 13 15 26 28 2018A 2019A 2020A YTD Q3 2021A
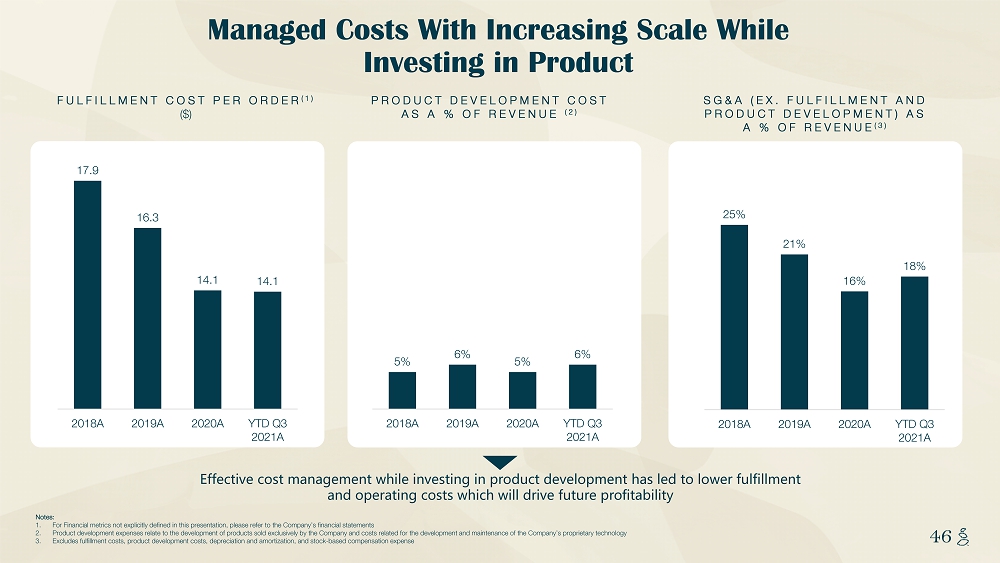
NOTES START FROM HERE AND GROW UP CONTENT BELOW THIS LINE CONTENT BELOW THIS LINE SUBTITLE BELOW THIS LINE TITLE CAN NOT GO ABOVE THIS LINE 46 46 FULFILLMENT COST PER ORDER (1) ($) PRODUCT DEVELOPMENT COST AS A % OF REVENUE (2) SG&A (EX. FULFILLMENT AND PRODUCT DEVELOPMENT) AS A % OF REVENUE (3) Managed Costs With Increasing Scale While Investing in Product Effective cost management while investing in product development has led to lower fulfillment and operating costs which will drive future profitability Notes: 1. For Financial metrics not explicitly defined in this presentation, please refer to the Company’s financial statements 2. Product development expenses relate to the development of products sold exclusively by the Company and costs related for the dev elopment and maintenance of the Company’s proprietary technology 3. Excludes fulfillment costs, product development costs, depreciation and amortization, and stock - based compensation expense 17.9 16.3 14.1 14.1 2018A 2019A 2020A YTD Q3 2021A 5% 6% 5% 6% 2018A 2019A 2020A YTD Q3 2021A 25% 21% 16% 18% 2018A 2019A 2020A YTD Q3 2021A
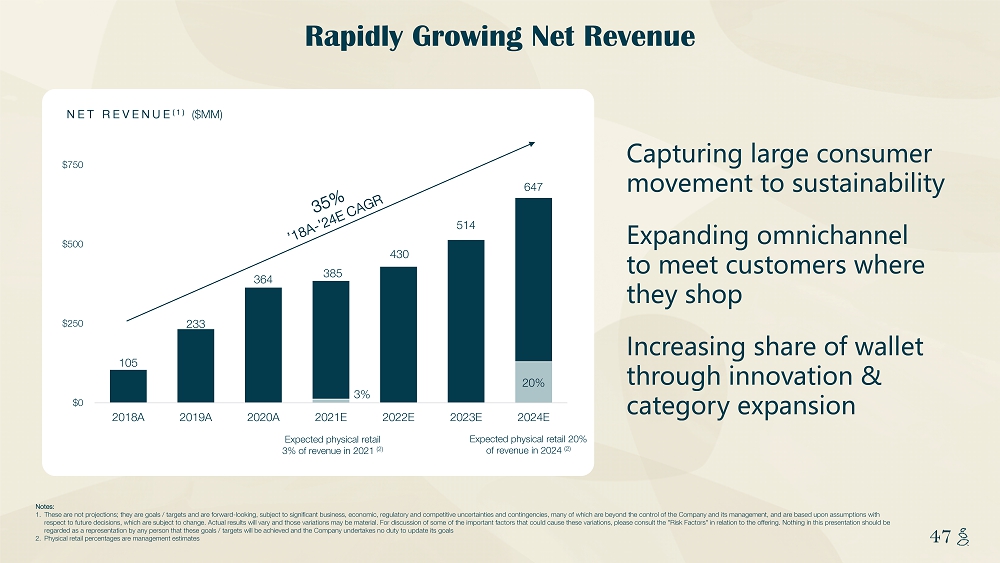
NOTES START FROM HERE AND GROW UP CONTENT BELOW THIS LINE CONTENT BELOW THIS LINE SUBTITLE BELOW THIS LINE TITLE CAN NOT GO ABOVE THIS LINE 47 47 Rapidly Growing Net Revenue Notes: 1. These are not projections; they are goals / targets and are forward - looking, subject to significant business, economic, regulato ry and competitive uncertainties and contingencies, many of which are beyond the control of the Company and its management, a nd are based upon assumptions with respect to future decisions, which are subject to change. Actual results will vary and those variations may be material. For dis cussion of some of the important factors that could cause these variations, please consult the "Risk Factors" in relation to the offering. Nothing in this presentation should be regarded as a representation by any person that these goals / targets will be achieved and the Company undertakes no duty to upd ate its goals 2. Physical retail percentages are management estimates Capturing large consumer movement to sustainability Expanding omnichannel to meet customers where they shop Increasing share of wallet through innovation & category expansion NET REVENUE (1) ($MM) Expected physical retail 3 % of revenue in 2021 (2) Expected physical retail 20 % of revenue in 2024 (2) 3% 20% 105 233 364 385 430 514 647 $0 $250 $500 $750 2018A 2019A 2020A 2021E 2022E 2023E 2024E
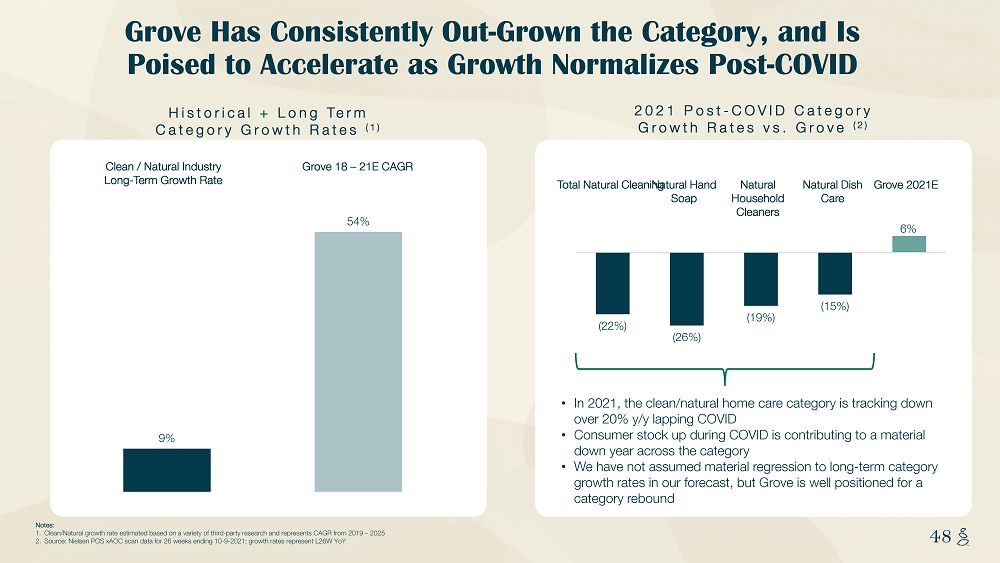
NOTES START FROM HERE AND GROW UP CONTENT BELOW THIS LINE CONTENT BELOW THIS LINE SUBTITLE BELOW THIS LINE TITLE CAN NOT GO ABOVE THIS LINE 48 48 Notes: 1. Clean/Natural growth rate estimated based on a variety of third - party research and represents CAGR from 2019 – 2025 2. Source: Nielsen POS xAOC scan data for 26 weeks ending 10 - 9 - 2021; growth rates represent L26W YoY Grove Has Consistently Out - Grown the Category, and Is Poised to Accelerate as Growth Normalizes Post - COVID Historical + Long Term Category Growth Rates (1 ) 2021 Post - COVID Category Growth Rates vs. Grove ( 2) • In 2021, the clean/natural home care category is tracking down over 20% y/y lapping COVID • Consumer stock up during COVID is contributing to a material down year across the category • We have not assumed material regression to long - term category growth rates in our forecast, but Grove is well positioned for a category rebound 9% 54% Clean / Natural Industry Long - Term Growth Rate Grove 18 – 21E CAGR Total Natural Cleaning Natural Hand Soap Natural Household Cleaners Natural Dish Care Grove 2021E (22%) (26%) (19%) (15%) 6% 2018A 2019A 2020A 2021E 2022E
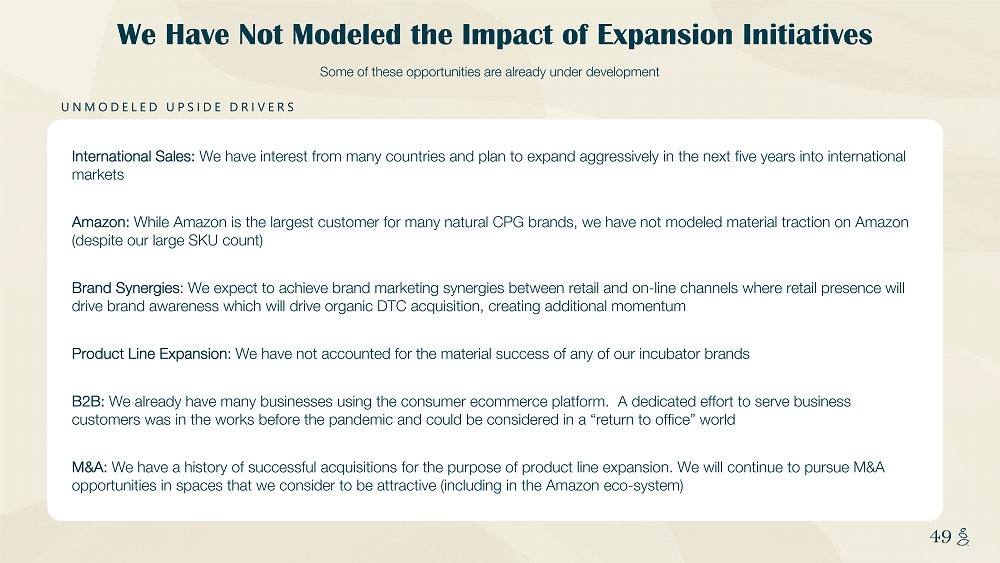
NOTES START FROM HERE AND GROW UP CONTENT BELOW THIS LINE CONTENT BELOW THIS LINE SUBTITLE BELOW THIS LINE TITLE CAN NOT GO ABOVE THIS LINE 49 49 We Have Not Modeled the Impact of Expansion Initiatives UNMODELED UPSIDE DRIVERS Some of these opportunities are already under development International Sales: We have interest from many countries and plan to expand aggressively in the next five years into international markets Amazon: While Amazon is the largest customer for many natural CPG brands, we have not modeled material traction on Amazon (despite our large SKU count) Brand Synergies : We expect to achieve brand marketing synergies between retail and on - line channels where retail presence will drive brand awareness which will drive organic DTC acquisition, creating additional momentum Product Line Expansion : We have not accounted for the material success of any of our incubator brands B2B: We already have many businesses using the consumer ecommerce platform. A dedicated effort to serve business customers was in the works before the pandemic and could be considered in a “return to office” world M&A: We have a history of successful acquisitions for the purpose of product line expansion. We will continue to pursue M&A opportunities in spaces that we consider to be attractive (including in the Amazon eco - system)
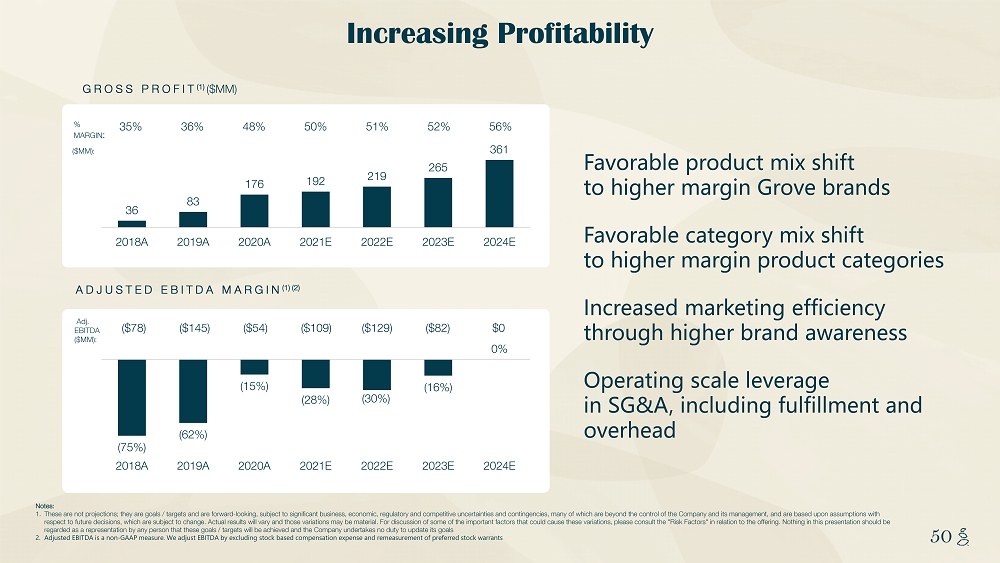
NOTES START FROM HERE AND GROW UP CONTENT BELOW THIS LINE CONTENT BELOW THIS LINE SUBTITLE BELOW THIS LINE TITLE CAN NOT GO ABOVE THIS LINE 50 50 Increasing Profitability Favorable product mix shift to higher margin Grove brands Favorable category mix shift to higher margin product categories Increased marketing efficiency through higher brand awareness Operating scale leverage in SG&A, including fulfillment and overhead GROSS PROFIT (1) ($MM) 36 83 176 192 219 265 361 2018A 2019A 2020A 2021E 2022E 2023E 2024E 36% 48% 50% 52% 56% 35% 51% % MARGIN : (75%) (62%) (15%) (28%) (30%) (16%) 0% 2018A 2019A 2020A 2021E 2022E 2023E 2024E ADJUSTED EBITDA MARGIN (1) (2) ($78) ($145) ($54) ($129) $0 ($82) ($109) Adj. EBITDA ($MM): Notes: 1. These are not projections; they are goals / targets and are forward - looking, subject to significant business, economic, regulato ry and competitive uncertainties and contingencies, many of which are beyond the control of the Company and its management, a nd are based upon assumptions with respect to future decisions, which are subject to change. Actual results will vary and those variations may be material. For dis cussion of some of the important factors that could cause these variations, please consult the "Risk Factors" in relation to the offering. Nothing in this presentation should be regarded as a representation by any person that these goals / targets will be achieved and the Company undertakes no duty to upd ate its goals 2. Adjusted EBITDA is a non - GAAP measure. We adjust EBITDA by excluding stock based compensation expense and remeasurement of prefe rred stock warrants ($MM):
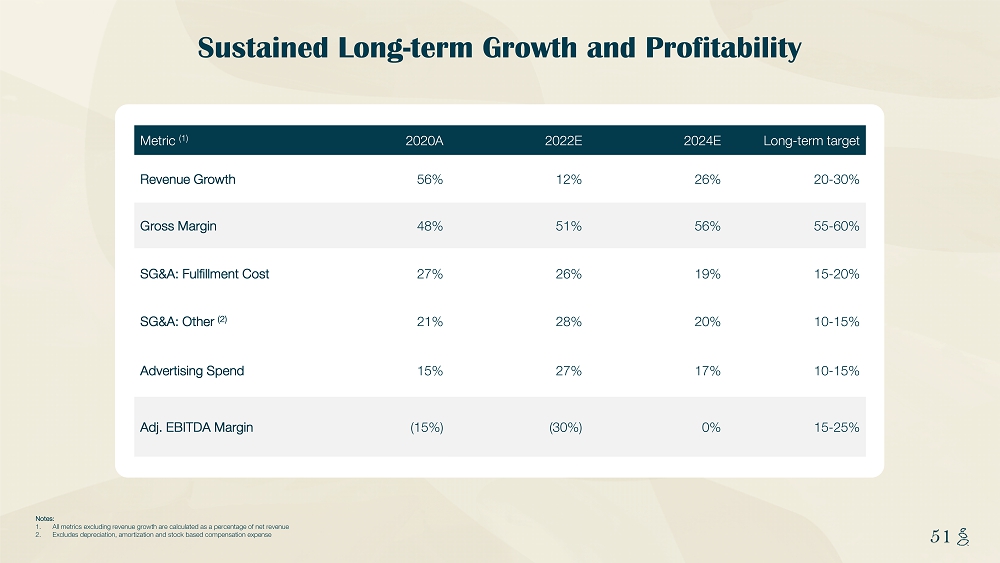
NOTES START FROM HERE AND GROW UP CONTENT BELOW THIS LINE CONTENT BELOW THIS LINE SUBTITLE BELOW THIS LINE TITLE CAN NOT GO ABOVE THIS LINE 51 51 Sustained Long - term Growth and Profitability Notes: 1. All metrics excluding revenue growth are calculated as a percentage of net revenue 2. Excludes depreciation, amortization and stock based compensation expense Metric (1) 2020A 2022E 2024E Long - term target Revenue Growth 56% 12% 26% 20 - 30% Gross Margin 48% 51% 56% 55 - 60% SG&A: Fulfillment Cost 27% 26% 19% 15 - 20% SG&A: Other (2) 21% 28% 20% 10 - 15% Advertising Spend 15% 27% 17% 10 - 15% Adj. EBITDA Margin (15%) (30%) 0% 15 - 25%
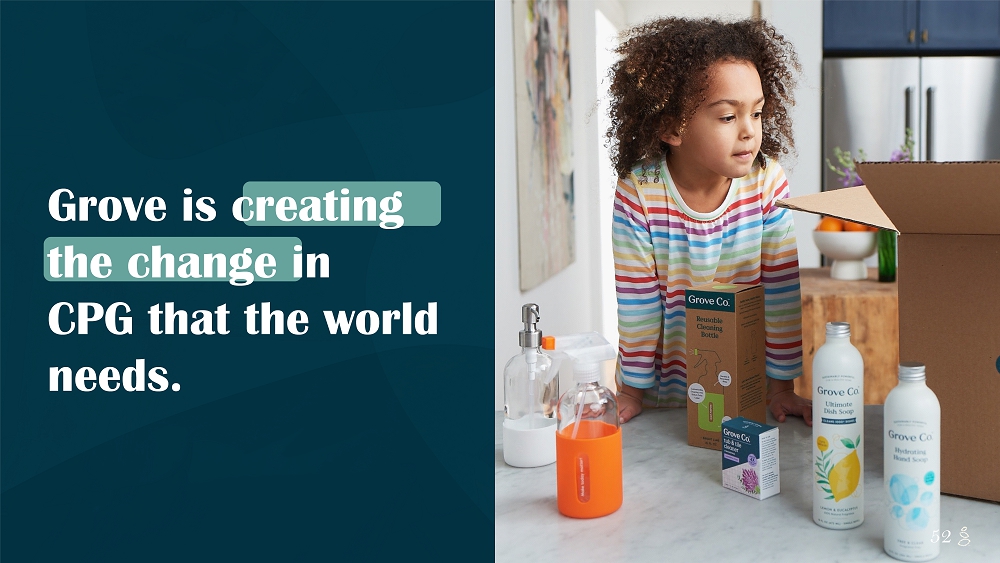
NOTES START FROM HERE AND GROW UP CONTENT BELOW THIS LINE CONTENT BELOW THIS LINE SUBTITLE BELOW THIS LINE TITLE CAN NOT GO ABOVE THIS LINE 52 Grove is creating the change in CPG that the world needs. 52

NOTES START FROM HERE AND GROW UP CONTENT BELOW THIS LINE CONTENT BELOW THIS LINE SUBTITLE BELOW THIS LINE TITLE CAN NOT GO ABOVE THIS LINE 53 53 APPENDIX Supplemental Materials 53
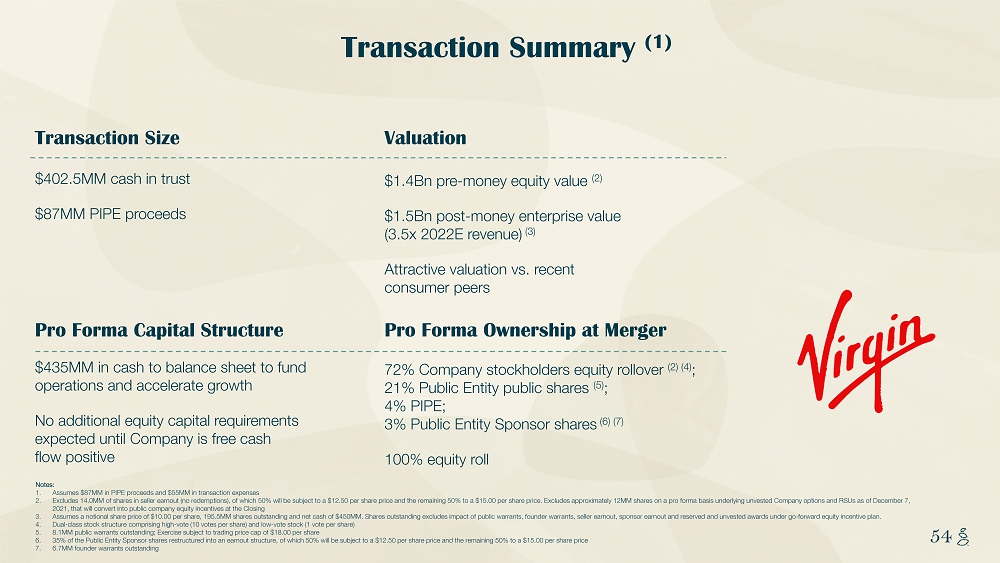
NOTES START FROM HERE AND GROW UP CONTENT BELOW THIS LINE CONTENT BELOW THIS LINE SUBTITLE BELOW THIS LINE TITLE CAN NOT GO ABOVE THIS LINE 54 54 Transaction Summary (1) Transaction Size Pro Forma Capital Structure Valuation Pro Forma Ownership at Merger Notes: 1. Assumes $87MM in PIPE proceeds and $55MM in transaction expenses 2. Excludes 14.0MM of shares in seller earnout (no redemptions), of which 50% will be subject to a $12.50 per share price and th e r emaining 50% to a $15.00 per share price. Excludes approximately 12MM shares on a pro forma basis underlying unvested Company op tions and RSUs as of December 7, 2021, that will convert into public company equity incentives at the Closing 3. Assumes a notional share price of $10.00 per share, 195.5MM shares outstanding and net cash of $450MM. Shares outstanding exc lud es impact of public warrants, founder warrants, seller earnout, sponsor earnout and reserved and unvested awards under go - forwar d equity incentive plan. 4. Dual - class stock structure comprising high - vote (10 votes per share) and low - vote stock (1 vote per share) 5. 8.1MM public warrants outstanding; Exercise subject to trading price cap of $18.00 per share 6. 35% of the Public Entity Sponsor shares restructured into an earnout structure, of which 50% will be subject to a $12.50 per sha re price and the remaining 50% to a $15.00 per share price 7. 6.7MM founder warrants outstanding $402.5MM cash in trust $87MM PIPE proceeds $1.4Bn pre - money equity value (2) $1.5Bn post - money enterprise value (3.5x 2022E revenue) (3) Attractive valuation vs. recent consumer peers $435MM in cash to balance sheet to fund operations and accelerate growth No additional equity capital requirements expected until Company is free cash flow positive 72% Company stockholders equity rollover (2) (4) ; 21% Public Entity public shares (5) ; 4% PIPE; 3% Public Entity Sponsor shares (6) (7) 100% equity roll
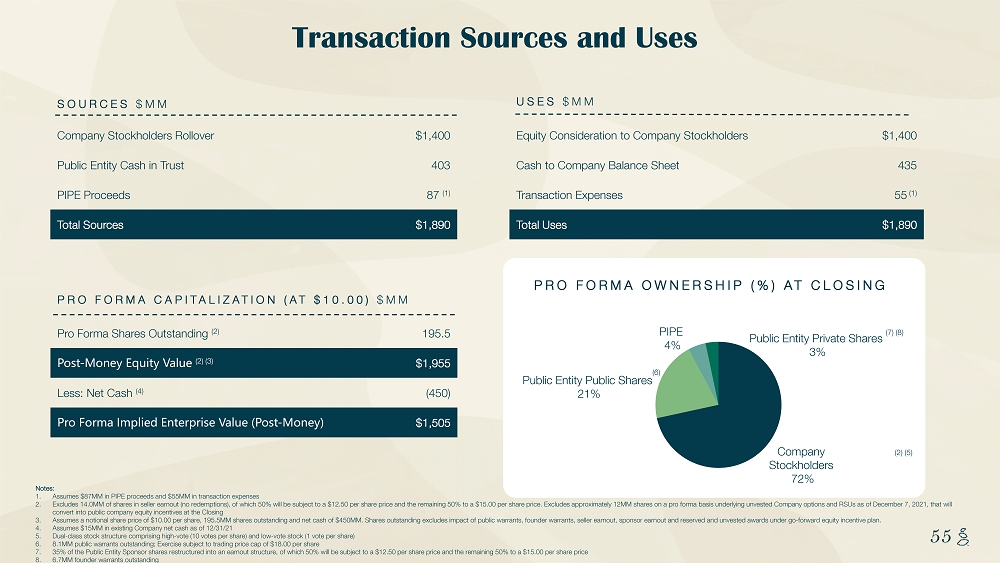
NOTES START FROM HERE AND GROW UP CONTENT BELOW THIS LINE CONTENT BELOW THIS LINE SUBTITLE BELOW THIS LINE TITLE CAN NOT GO ABOVE THIS LINE 55 55 Transaction Sources and Uses Notes: 1. Assumes $87MM in PIPE proceeds and $55MM in transaction expenses 2. Excludes 14.0MM of shares in seller earnout (no redemptions), of which 50% will be subject to a $12.50 per share price and th e r emaining 50% to a $15.00 per share price. Excludes approximately 12MM shares on a pro forma basis underlying unvested Company op tions and RSUs as of December 7, 2021, that will convert into public company equity incentives at the Closing 3. Assumes a notional share price of $10.00 per share, 195.5MM shares outstanding and net cash of $450MM. Shares outstanding exc lud es impact of public warrants, founder warrants, seller earnout , sponsor earnout and reserved and unvested awards under go - forward equity incentive plan. 4. Assumes $15MM in existing Company net cash as of 12/31/21 5. Dual - class stock structure comprising high - vote (10 votes per share) and low - vote stock (1 vote per share) 6. 8.1MM public warrants outstanding; Exercise subject to trading price cap of $18.00 per share 7. 35% of the Public Entity Sponsor shares restructured into an earnout structure, of which 50% will be subject to a $12.50 per share price and the remaining 50% to a $15.00 per share price 8. 6.7MM founder warrants outstanding SOURCES $MM PRO FORMA CAPITALIZATION (AT $10.00) $MM PRO FORMA OWNERSHIP (%) AT CLOSING Company Stockholders Rollover $1,400 Public Entity Cash in Trust 403 PIPE Proceeds 87 (1) Total Sources $1,890 Equity Consideration to Company Stockholders $1,400 Cash to Company Balance Sheet 435 Transaction Expenses 55 (1) Total Uses $1,890 Pro Forma Shares Outstanding (2) 195.5 Post - Money Equity Value (2) (3) $1,955 Less: Net Cash (4) (450) Pro Forma Implied Enterprise Value (Post - Money) $1,505 USES $MM Company Stockholders 72% Public Entity Public Shares 21% PIPE 4% Public Entity Private Shares 3% (2) (5) (7) (8) (6)
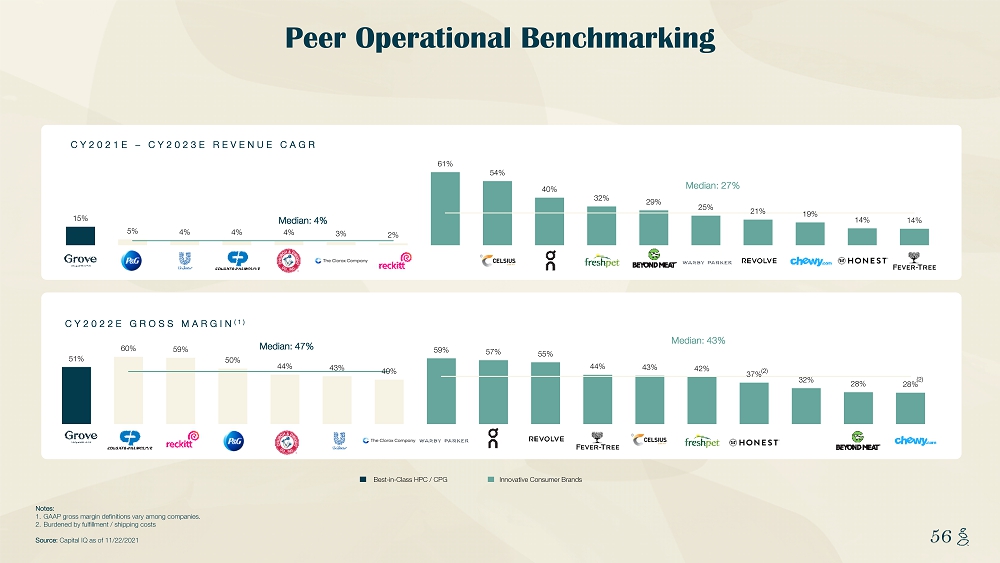
NOTES START FROM HERE AND GROW UP CONTENT BELOW THIS LINE CONTENT BELOW THIS LINE SUBTITLE BELOW THIS LINE TITLE CAN NOT GO ABOVE THIS LINE 56 56 Peer Operational Benchmarking Notes: 1. GAAP gross margin definitions vary among companies. 2. Burdened by fulfillment / shipping costs Source: Capital IQ as of 11/22/2021 CY2022E GROSS MARGIN (1) CY2021E – CY2023E REVENUE CAGR Best - in - Class HPC / CPG Innovative Consumer Brands (2) (2) 51% 60% 59% 50% 44% 43% 40% 59% 57% 55% 44% 43% 42% 37% 32% 28% 28% Median: 47% Median: 43% 15% 5% 4% 4% 4% 3% 2% 61% 54% 40% 32% 29% 25% 21% 19% 14% 14% Median: 4% Median: 27%
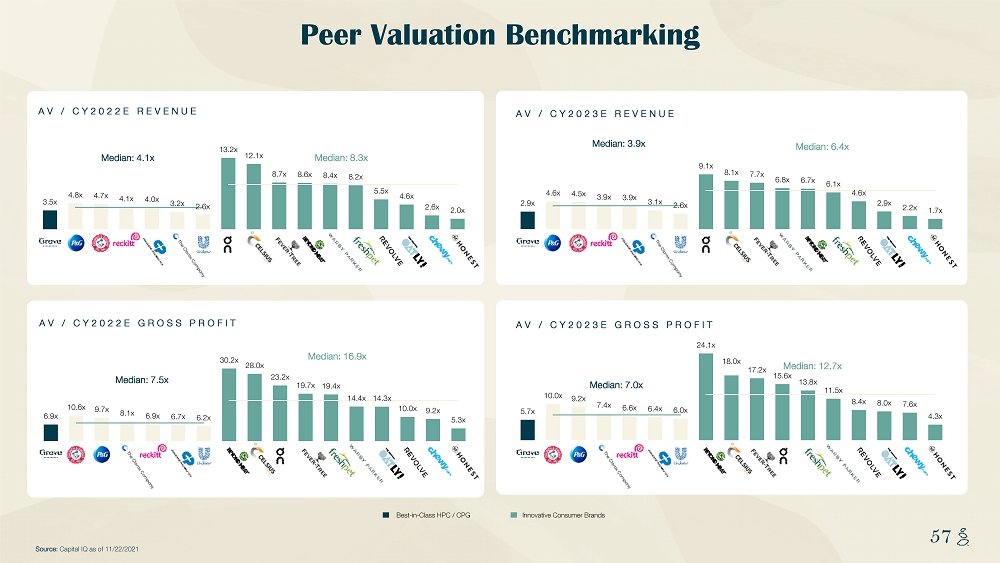
NOTES START FROM HERE AND GROW UP CONTENT BELOW THIS LINE CONTENT BELOW THIS LINE SUBTITLE BELOW THIS LINE TITLE CAN NOT GO ABOVE THIS LINE 57 57 Peer Valuation Benchmarking Source: Capital IQ as of 11/22/2021 Best - in - Class HPC / CPG Innovative Consumer Brands AV / CY2023E REVENUE AV / CY2022E REVENUE AV / CY2022E GROSS PROFIT AV / CY2023E GROSS PROFIT 3.5x 4.8x 4.7x 4.1x 4.0x 3.2x 2.6x 13.2x 12.1x 8.7x 8.6x 8.4x 8.2x 5.5x 4.6x 2.6x 2.0x Median: 4.1x Median: 8.3x 2.9x 4.6x 4.5x 3.9x 3.9x 3.1x 2.6x 9.1x 8.1x 7.7x 6.8x 6.7x 6.1x 4.6x 2.9x 2.2x 1.7x Median: 3.9x Median: 6.4x 6.9x 10.6x 9.7x 8.1x 6.9x 6.7x 6.2x 30.2x 28.0x 23.2x 19.7x 19.4x 14.4x 14.3x 10.0x 9.2x 5.3x Median: 7.5x Median: 16.9x 5.7x 10.0x 9.2x 7.4x 6.6x 6.4x 6.0x 24.1x 18.0x 17.2x 15.6x 13.8x 11.5x 8.4x 8.0x 7.6x 4.3x Median: 7.0x Median: 12.7x
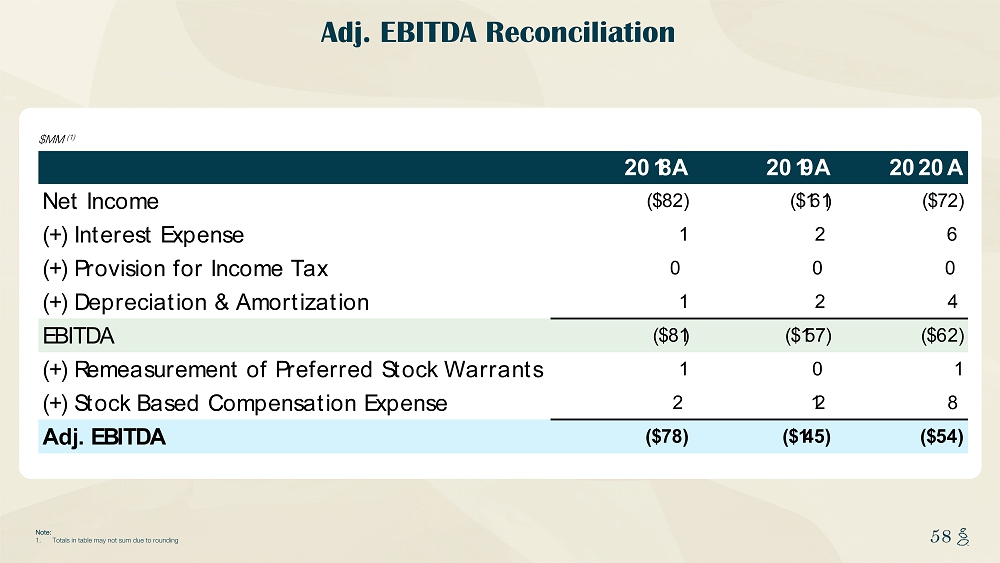
NOTES START FROM HERE AND GROW UP CONTENT BELOW THIS LINE CONTENT BELOW THIS LINE SUBTITLE BELOW THIS LINE TITLE CAN NOT GO ABOVE THIS LINE 58 58 Adj. EBITDA Reconciliation $MM (1) Note: 1. Totals in table may not sum due to rounding 2018A 2019A 2020A Net Income ($82) ($161) ($72) (+) Interest Expense 1 2 6 (+) Provision for Income Tax 0 0 0 (+) Depreciation & Amortization 1 2 4 EBITDA ($81) ($157) ($62) (+) Remeasurement of Preferred Stock Warrants 1 0 1 (+) Stock Based Compensation Expense 2 12 8 Adj. EBITDA ($78) ($145) ($54)
NOTES START FROM HERE AND GROW UP CONTENT BELOW THIS LINE CONTENT BELOW THIS LINE SUBTITLE BELOW THIS LINE TITLE CAN NOT GO ABOVE THIS LINE 59 Thank You!